My Radio Mobile
Illustrated Handbooks...
350 pages of reference and 'How to'
data in 19 chapters.
Click here for more information!
 Para el
Handbook
Edición en Español
- Haga clic
aquí.
Para el
Handbook
Edición en Español
- Haga clic
aquí.
y
con un 10% de descuento si usted compró una versión en idioma inglés.
Also just released: the Radio Mobile
Handbook Companion
184 pages of illustrated Tutorial text.
This takes you through the Handbook
chapters by using supplied
Networks with descriptions which enable you to
generate
all the plots shown in the Handbook!
Click here for more information!
antenneX website is down at the moment,
but can
be requested from HB-Sales@g3tvu.co.uk
|
Radio Mobile Handbook
|
A
recent release consisting of 350 pages in 19 chapters. This is an
illustrated step by step descriptive volume in pdf format covering all
aspects of the operation of Radio Mobile
and use of the many functions and features. This format allows full word searches of
the Handbook text.
Can
be downloaded from HB-Sales@g3tvu.co.uk
|
|
Radio Mobile Handbook
Edición en Español! |
Este Handbook es una referencia ‘indispensable’ para el que desee explorar en forma
rápida las prestaciones del Radiomobile y todas sus facetas, para producir el
tipo de cobertura de señales de radio que se requieran. Este Handbook hace el
proceso de aprendizaje paso a pasofácil e intuitivo, con guías ilustradas.
The Handbook
Edición
en Español
Radio
móvil
manual
acompañante
Can
be requested from HB-Sales@g3tvu.co.uk |
|
Radio Mobile Handbook Companion |
A
recent
release of a Tutorial text which takes you through the Handbook
chapters, and using the supplied chapter referenced Networks allows you
to produce the chapter plots and thus gain experience in the use of the
functions and features of
Radio Mobile.
This is a version which includes
descriptions of all the program updates.
Can
be requested from HB-Sales@g3tvu.co.uk |
|
Radio Mobile |
The
Front descriptive page for the
Radio Mobile
program, with links to other pages and
related descriptive articles.
|
|
Quick Start |
This is the starting page where there is an introduction to
Radio Mobile
and details of the steps required to
download and install the latest version on your computer.
The basic program concepts are described, followed by how to download
and run my installer, which sets up the program on your computer
with my
'Base
Network'.
The page also has a link to the
Installation
page which shows a
'Walk through' of the sequence
of panes which will be seen when running the installer.
My 'Base Network'
consists of a map of my local area with a
Base,
Mobile
and
Hand Held
set of radio
Units
defined and placed as a working
VHF demonstrator.
The installer also generates all the height data files for the area
enabling the program features to be explored.
The page ends
with additional notes showing how to access the basic functions available, and a
trouble-shooting table.
|
|
Installation
|
This page shows a non-installing 'Walk Through' of the of the
successive panes generated by the installer
'Radio Mobile Setup.exe'.
The file is available from the
Quick Start and
RM Downloads
pages, accessed via the control buttons at the bottom of the page, or
the page names on the left.
|
|
Reconfiguring the Base Network
|
Details are given on this page to demonstrate how my
'Base Network' can be reconfigured
to show your own area complete with reconfigured unit locations and
parameters. There are also illustrations on how to change the Elevation
data resolution and obtain the best accuracy for the plots.
 |
|
Base
Network Settings
|
There are numerous screenshots
showing the stages of setup procedure to enable modification of the
program parameters to suit your individual requirements.
The
location and
settings
used to generate the
Base Network
are shown. These are the panes which require modification when you are
changing Unit Names, locations
and
Radio Operating Systems.
The Map Properties pane is
also shown which defines the
centre location
and
area displayed by the map,
plus the dimensions of the screen display in
pixels.
If
you require to install the program files in an alternative location,
notes in Blue
are shown defining the entries
which will require modification.
|
|
Folder Layout
|
A
description of the Directory and Folder layout I have used in my
installer, and the additional files contained above those produced by a
Manual installation. The Manual installation is also described, with a
suggested folder layout to avoid main drive root area congestion.
|
|
Network
Radio Link and Route
Styles
|
The action of the Network Properties
Style pane
is demonstrated on a
Network,
a
Radio Link
and a
Route
plot. By changing the settings, the displayed signal strength colour
limits can be modified to suit requirements. These settings and colours
can also be used in Polar and Combined Cartesian plots.
|
|
Once you
get going
|
This
next page moves on to show how to create
Extra Units,
Place them on the map, Move and Rename them.
There are also additional links to the
Changing map location,
Radio Link
and
Radio Coverage
pages. |
|
Changing Location
|
A detailed
description, with screenshots, of how to change the Base Network
location from
Central UK to any other part of the World
to suit your own requirements.
There is also a
description of the use of the
World Map
and an
Alternate world map
for changing the map location.
The Alternate World map shows the UK, but can be replaced by your own
area map which can be generated by
Radio Mobile.
|
|
Radio Link
F2

|
The Radio Link pane gives
a visualisation of any selected
Radio Link
between selected a pair of Units. The
Radio Link ground profile is displayed along with the Radio Link radio parameters
and Fresnel zones.
A cursor can be moved
along the radio path with its position being reflected on the main
display, path parameters and the elevation being indicated for the
cursor position.
Antenna heights can be
incremented to immediately observe the effect on the Radio Path.
Alternate
displays can show tabular data or the view of one Unit from the other
taken over an elevation map or aerial photograph.
The additional data
generated and changed representation, where Land cover is being used, is
also shown.
Link Data can be exported to :
1) a .txt file for further analysis, or
2) to RMPath, a stand alone link viewer with
selectable Fresnel zone display, or
3) to Google Earth, where a visualisation of
the Radio Link can be observed, and a display of Fresnel zones plotted
for the path.
|
|
Land cover
|
This page describes the use of
Land coverage data, which indicates the type
and height of foliage covering the ground.
First, the data can be
used to merge with existing plots,
and second, this data can be
added to the ground profile for propagation studies. In the propagation
studies, the losses incurred by Land cover impinging on part of the
Radio Link Path are calculated, and included in the final display.
|
|
Radio Coverage
|
Radio
Coverage Plots can be performed in
Single Polar
or
Combined Cartesian
format. The working units displayed being selected from
S-Unit,
dBm,
μV
or
dBμV/m
over an automatic or defined range.
See this page for a
description of the operating panes, and details of how to use the
features which are common to the plots, with links to the separate plot
pages.
|
|
Single Polar
Coverage
F3

|
Single Polar
plots are performed in a
Radial
manner, where plot areas may be defined by azimuth and
radial range. The plot resolution reduces towards the edge of the area,
as it is defined in degree wedges.
'Network Style'
plots have been added to the Single Polar Coverage pane. |
|
Combined Cartesian plots
F4

|
With a
Combined Cartesian
plot, the plot is performed in an X-Y mode with a
defined pixel resolution over the whole plot area. There is also an option for selected
rectangular area plots, and also zoomed area plots to be performed.
It is more advisable to perform
coverage plots over a radial range rather than the full rectangular
screen area - this keeps the pixel resolution over the plot area
consistent with the number of data records being utilised.
Note that optional
SIGnal files can now be
generated which allow the actual signal level data at the cross wire cursor
to be
reported in the data area at the bottom of the pane. These files are
saved with the plot so can be accessed later on opening a saved plot.
Using the
Combined Cartesian
Plots, the following different functions can be performed, but see the
Cartesian pane
page for a description of the controls available.
|
|
Combined
Cartesian Plot Features
|
Single Unit Coverage
Where a single fixed Unit is selected, and the
radio coverage to a defined mobile Unit is plotted over the map area.
|
Multiple Unit Coverage
Where a
number of fixed Units are selected, and the combined Best Coverage
signal to a defined mobile Unit is plotted over the map area. |
|
Network Style coverage
Plots using this feature display
signal levels in colour bands determined by the Network 'Style' pane
settings.
|
Best Unit for Coverage

Where a
number of fixed Units are selected, and the one giving best signal
coverage to a defined mobile unit is plotted over the map area. The
'Best Unit'
being shown by using the Unit label background colour for the coverage
area.
Signal to Interference
margin can be specified for the plots!
|
Detailed Area Coverage
A signal plot is
performed over a full screen, zoomed area of the map, using any of the methods shown. |
 Interference coverage
Plots are performed
showing areas of a map where a defined signal margin between the Wanted
and Interfering Unit are achievable. |
 Fresnel Zone Coverage
Plots of areas of the
map indicating selected Fresnel zone clearance regions. |
|
Coverage tools and notes |
Coverage tools and notes.
The page also has notes
on:
- mouse click shortcuts
- signal plot legend location
- single colour plots with level
customisation
- notes on gain antenna patterns
- how to produce a 'blank' white screen
for plots
- the Unit description pane
- measuring selected Unit to cursor
location azimuth and distance |
|
Route
Radio Coverage
F6

|
Using the
Object Editor,
Route lines can be drawn on the map using waypoints
and saved for future use. The
Route Radio Coverage
feature is described, where the Radio Performance between:
a)
a specified fixed Unit,
with
b)
a mobile Unit traversing the Route
on the map in defined distance step increments,
may be evaluated.
At any
point on the Route, the
Radio Link path profile
and parameters can be
examined in detail using the Radio Link
pane.
The
Route Radio Coverage
pane shows a linear
representation of the Route
with a plot of signal strength, and elevation, at every point with an
indication of
Line of
Sight
paths.
Moving the cursor along the route gives an indication of Linear
distance, Radio Path length and azimuth, Elevation and signal strength
at the cursor location. The Radio Link Path Profile to the cursor
position is also shown at the bottom of the pane.
Coverage data from a drawn Route can be saved in
Text or kml format. When the
Route.klm file is clicked, it is
exported into Google Earth Temporary places folder which then allows the
Route to be flown, and if required the calculation waypoints with their
signal levels displayed. |
|
Split Route Radio Coverage
F6
|
A second ability of the
Object Editor
is to generate a sequence of unconnected
Route segments
on the map. This page describes how to use the Object Editor to generate
segmented multiple Routes and evaluate the
Radio Performance
along a sequence of
Split Routes.
|
|
Find Best Sites in a
Network
F5
 |
Where it is
required to locate a Control Unit,
capable of communicating with a number of
fixed subordinate Units
within a network,
at a suitable position on a map, the
Find Best Sites
function can be invoked.
The resultant plot displays areas where
communication is achievable with a specified percentage of subordinate
Units, allowing a choice of location to be made for the Control Unit
with consideration to site accessibility.
|
|
Find Best Sites
using Waypoints
F5
|
Waypoints
can be placed on a map using the
Object Editor,
and the Best Site for a
Control Unit
to communicate with these locations found.
Where it is
required to locate a Control Unit,
capable of communicating with a
mobile
subordinate Unit as it
traverses a Route,
at a suitable accessible position on a map, the
Find Best Sites
function can be invoked, but using
Waypoints.
The Waypoints are generated using the
Object Editor,
and this procedure is also suitable for
Split Routes.
|
|
Visual Coverage
F11

|
A
Visual Coverage
plot is performed on the
Base Network,
with a demonstration of the use of the
Visual Horizon
pane.
The Observer location and
height can be selected, with the
Azimuth and Elevation angle ranges of the observation.
The Observed Target height and
range are also selectable.
|
|
Visual Horizon
F12

|
Using the
Visual Horizon
pane, the location of the optical Horizon from a location at a
particular selected azimuth is reflected by the main screen cursor, with Azimuth and distance to
the point displayed on the status bar.
The height of the Observer
and Target can be set, and the Elevation angle viewed may be generated
automatically or selected.
|
|
Merging
Pictures
F7
 |
Screenshots are shown of the effects of the various
Merge options on the resultant picture. The use of Merge after a zoom on
a screen area is shown, which produces a high resolution picture of the
smaller area.
Access to external Data
Sources is also demonstrated, with
pictures of Road and Aerial photograph merges.
|
|
Antenna Alignment

|
Screenshots of
the various control panes, with descriptions of the operation and
alignment of
Gain
Antennas.
|
|
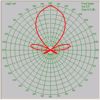
Antenna
Plots
|
A description of the
operation of a new '3D-360˚ gain plot
accepting Omni phased verticals'
revisited spreadsheet, which allows
you to
generate your own antenna radiation patterns at
5˚
or 10˚ increments
for use in Radio Mobile.
In this version the antenna gain is entered directly in dB, and it also
works with Omni Phased antenna patterns where the maximum Elevation gain
does not occur at the 0˚
horizontal value.
This new spreadsheet
enables 3D 'Azimuth + Elevation'
data to be generated at 5˚ or 10˚ intervals for use in ***.ant files,
and works for full 360˚ 3D plots.
The 2D AntDiag.xls spreadsheet
allows 10˚
'Azimuth only' relative gain entries
to be entered,
with gain values described as -ve dB from maximum gain.
The spreadsheets are
available from the
'RM Downloads'
page.
|
|
Antenna
Pattern
Viewer
|
This page shows the 3D
Antenna Pattern Viewer, and the effect of its use with the
Network Properties, Polar plots, Cartesian Plots and Radio
Link pane. The viewer can also explore the patterns in a 'stand
alone' mode.
|
|
Large
Maps
and Pictures
|
A look
at the use of larger maps and
pictures
which are
over
screen size
for better resolution when using the
Base network, and a description of the features available with
these. This includes the
automatic self-centring
of large pictures to the area of interest when
using both the Radio Link
and Route
features. This function generates Rolling Maps under the cursor
point of interest. |
|
Object Editor
 |
Use of the
Object Editor
in generating
Waypoints for Routes
is shown. In
particular, how to generate routes over zoomed segments of the maps to
improve precision of placement.
The Object editor
can also edit previously generated route waypoint locations by deletion
and insertion.
|
|
Fox Hunt
 |
This feature provides the facility to
plot azimuth bearing lines from up to six Units on a map for use in
Radio Direction Finding
'Fox Hunts'. It is now possible to produce
bearing uncertainty coloured
'Wedge'
plots along the azimuth bearing, and also up to
six different
'Angle
coverage'
display plots for gain antennas from a single unit.
|
|
Importing
Pictures
|
A
description, and example, of how a picture can be imported and
calibrated for use in Radio
Mobile. This
takes a scanned UK Ordinance Survey map portion and imports it into the
Base Network. Coordinate conversion to WGS-84 datum is also shown.
Pictures generated in
Radio Mobile
can also be imported into
Google Earth.
User pictures can be taking from
Radio Mobile
and calibrated as an Overlay.
Coverage plots may be saved in .png format,
where their background is made transparent by
Radio Mobile, and a corresponding
.kml file generated for direct import into
Google Earth.
During import, the opacity of the picture overlay can be adjusted in
Google Earth.
|
|
Exporting and
Importing Units
|
Units may be
exported from Radio Mobile
as Text or Google Earth klm files. The klm files can then be imported
into Google Earth to show Unit locations as placemarks.
It is also possible to
generate a set of placemarks in Google Earth, which when saved as a klm
file, can then be
imported into
Radio Mobile
as
Unit locations.
|
|
Network Files
|
Network files can be saved and opened in *.net
or *.csv formats. The CSV format enables all the network parameters to
be viewed - and changed if required - in five *.csv files using Excel. |
|
RM Batch Files
|
Command line Batch files
can be generated allowing a sequence of radial Combined Cartesian or
Polar plots to be performed unattended. Colour pallets can be selected
with the range of signals to draw, and Land Coverage data incorporated
if required. It is also possible to generate the
SIGnal files associated with the various
plots if rerquired. |
|
RM Program Help Files
|
An index to the
Program help files
as web pages.
(F1 opens the help files in
the program)
|
|
RM Downloads
|
Location of links to:-
1) .pdf versions of all the web pages.
2)
Radio Mobile Setup.zip, my Installation
file in zip format.
3)
Introduction to Radio
Mobile
a Radio Communication
article.
4)
Application of Radio Mobile to Fox
Hunts
a Radio Communication
article.
5) Additional useful files
including an
Antenna Pattern file
generator.
6) A .pdf version of the Program Help Files.
7) G8HUL's UK & Irish NGR add-ons for Radio Mobile
and Stand-alone
UK NGR
to/from WGS-84 converter.
8)
UK Alternate World Map
- (unzip into RM folder).
9) Links to alternative
additional Documentation sources. |
|
Toolbar
Icons |
Description of the
Icon shortcuts
on the main window toolbar,
and how to customise them to your own requirements. |
|
How to...
|
Pieces of
information without a home:-
Keyboard
and Mouse Shortcuts.
Antenna alignment.
Antenna radiation
pattern generation.
Program Help Files.
UK National Grid Reference
coordinate Converter.
Positioning the Elevation
and other Legends.
Changing signal threshold colours for Radio Link and Route displays.
Using the
'Multiple
Unit' icons at one location.
Increase the number of
Units, Systems and Networks available.
Plus links to all other pages. |
|
Radio Mobile
On-line
|
An information page about the data requirements
and usage of the New
on-line version of the program for Radio Amateurs. You can create your
own account and keep your plots on the server, and make use of the vast
amount of data stored there to avoid having to download elevation and
land coverage data to your own computer. This facility can be driven
direct from any web browser.
A link button to the site is provided on
this page. |
|
Walk
Best Site |
A description
of my initial use of
Radio Mobile to find the
Best Site
for a Radio Relay Unit required to provide coverage of an 18 mile
charity walking event in the
UK Derbyshire Peak District.
|
Radio Mobile Screenshots
|
A
selection of screenshots from my
Base Network
- located in the
UK Derbyshire
Peak District - showing some of the features available from the program.
|