Single Polar Coverage
I can be contacted at E-mail address:-
![]()
Single Polar CoverageI can be contacted at E-mail address:-
|
|
|
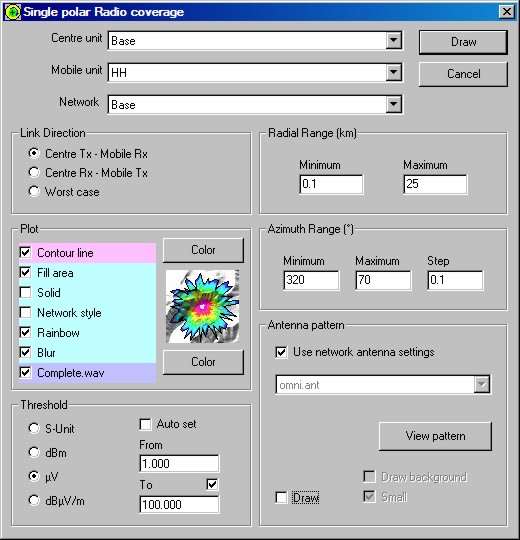
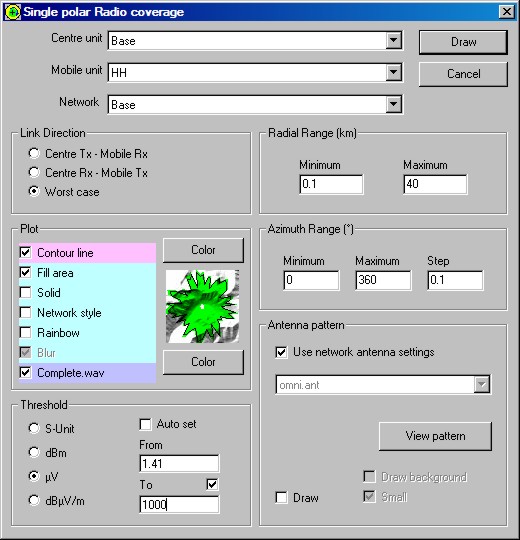
A click on the toolbar icon, Clicking 'F3' Or by opening 'Tools/Radio Coverage/Single Polar' will show this pane:
A 'Single Polar' plot is performed in an azimuth manner, centred on the selected 'Centre Unit' over a defined radial range and transmission direction. The plot resolution is generated in the selected 'degree step' wedges, over an azimuth range and in radial increments, i.e. this means that the perimeter of the plot has lower resolution than areas nearer to the centre.
The centre unit and the unit whose parameters are to be used as the receiver have to be selected. You also have to decide on the Units of measurement and range of signal levels to be displayed, (or use 'Auto set' to reference to the receiver threshold and maximum signal available), along with the Azimuth and Radial Range to be plotted. It should be noted that the display generated for a Fixed Unit 'Gain' antenna is as if that antenna was pointed towards a particular azimuth - it can be the link direction or defined, i.e. its radiation pattern and direction does apply to the plot. The antenna pattern can be shown on the plot by checking 'Draw' which creates a small drawing of the antenna pattern overlaid at its location aligned with its azimuth, with the capability of selection of a smaller version with or without a background. The Mobile Unit however is treated as if it has an 'Omni' antenna, even if in fact a gain antenna is specified in its System. The effect of this is to make a gain antenna at the Mobile Unit always point towards the Fixed Unit for every location.
On the pane above, the Link direction is selected as 'Centre Tx - mobile Rx', whilst the reverse direction performance of the 'mobile Tx to Fixed Rx' can also be plotted. See below for the 'Worst case' plot.
If required, the Network Antenna Pattern settings can be selected, or modified to changed requirements. The resulting pattern can be displayed by pressing the 'View Pattern' button. With the Omni antenna, above a change in the Azimuth or Elevation settings will have no effect as its pattern is circular for both. However if a gain antenna is in use, the Azimuth setting changes its direction whilst the Elevation setting relates to antenna tilt from its horizontal setting.
The 'Contour line', if selected, is drawn at the lower boundary of a plot, and with 'Rainbow' the fill is multicoloured. Where Rainbow isn't selected, the plot can be in a single colour showing the signal range set in 'Threshold'. The plot below has a Rainbow range of 1uV to 100uV selected. By using the 'Auto' check box, the program uses the receiver threshold as its lower signal level, and calculates the highest level from the signals available.
Note: During plots, the computer CPU load can be reduced by pressing the 'S' key to slow down processing, or paused using the Space Bar - these actions are reported on the lower data area of the pane.
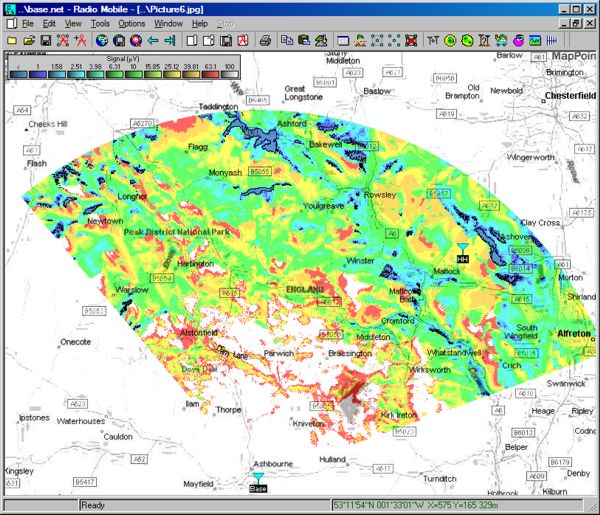
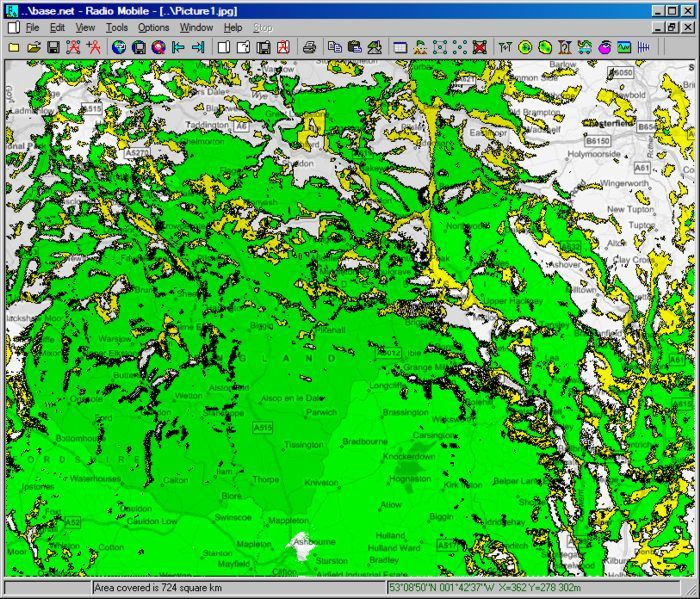
It is best to produce plots over greyscale or Black/White picture to avoid colour confusion. If a coloured map is used, you will be prompted to convert to grey scale before plotting. The sort of plot produced is shown below (at reduced resolution), for Base to Hand Held units for the Fixed Unit 'Omni' antenna defined above over a black/white road map.
Note: If a 'Blank' white screen is used for the plot, (generated as on the 'Radio Coverage' page), it will produce plots without any background detail which can be 'Merged' over other pictures as required.
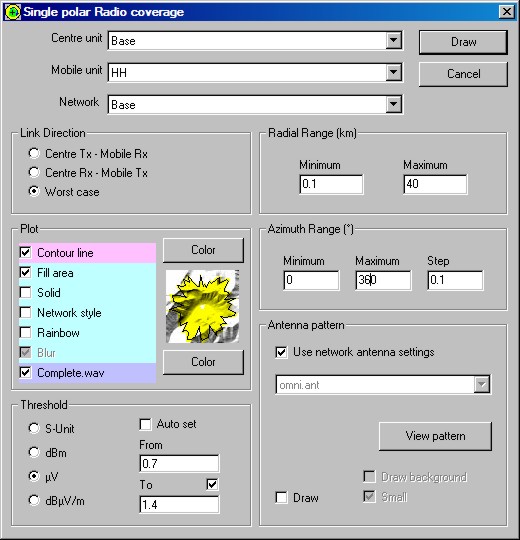
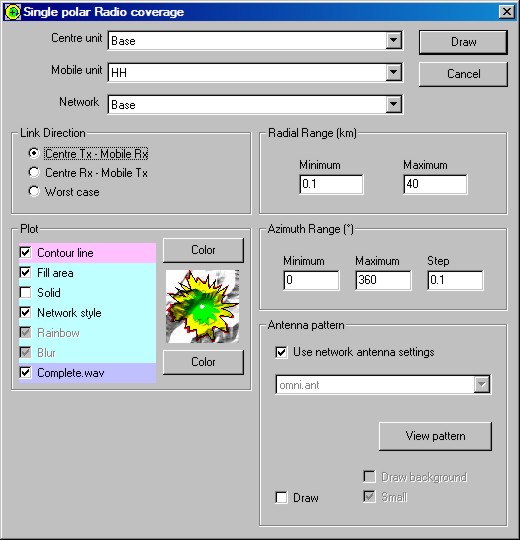
The 'Worst Case' plot is available which displays the worst signal level available for the two-way link. It is of particular interest when investigating the performance of a Radio Repeater to a low power mobile unit, and plotting the available communication area for this system.
Making a 'Worst Case' plot for the Base to HH Unit, which shows areas in the +/-3dB range displayed on Radio Links, the following settings can be used:
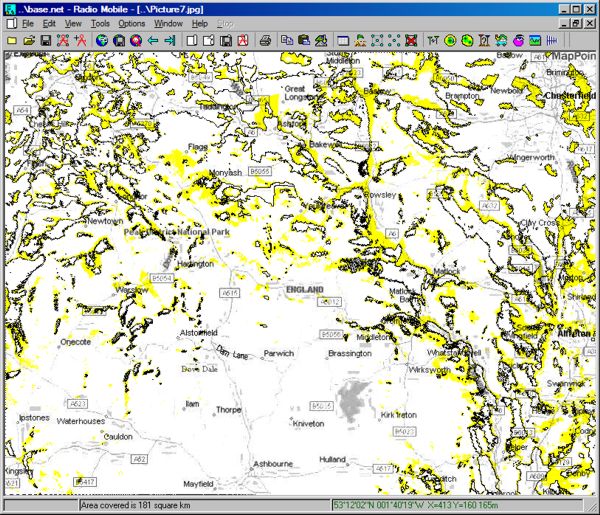
Which produces a single colour plot (and kept in new picture) of coverage areas in Yellow (with a black lower boundary) which has worst signals in the range of +/-3dB relative to 1uV.
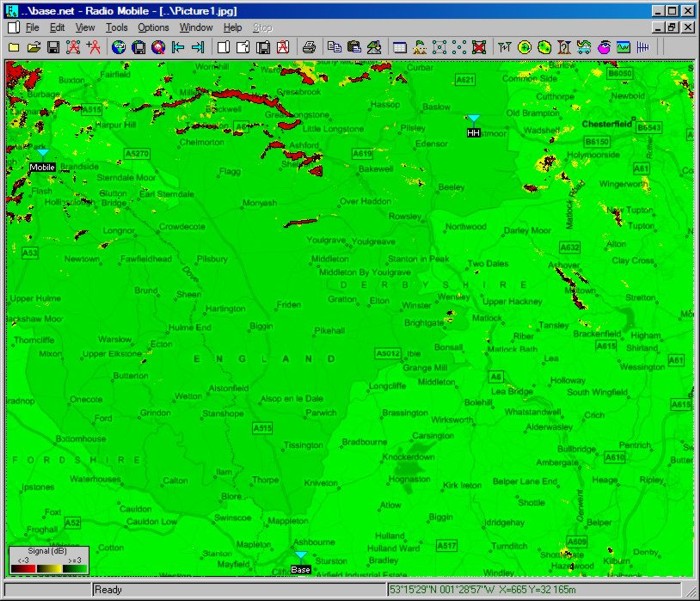
Whilst modifying the plot to show >+3dB as Green with these settings:
and 'kept in picture' produced
showing areas where two-way communications are possible in Green, and probable in Yellow.
Network Style plot: A Network Style plot was added after V10 of the program. With this plot the signal levels relative to the receiver sensitivity are displayed. The settings used here are for signals <-3dB shown in Red, +/-3dB as Yellow and signals >+3dB as Green. These signal colours are also shown on the displayed network paths. The following Style plot has been set up to show coverage from the Base unit to the HH unit with the above limits, so the threshold settings area has been removed.
Pressing Draw then produces this plot:
By setting the Style boundary limits for the yellow coloured area equal, only the red and green areas will be plotted. This form of two colour plot can be used as a signal conformance plot if required.
To see how to relocate the signal strength legend click Here
This page is available in .pdf format here.
© Copyright G3TVU 26th October 2017
|