Radio Coverage
I can be contacted at E-mail address:-
![]()
Radio CoverageI can be contacted at E-mail address:-
|
|
|
Found under:- 'Tools/Radio Coverage' (A 'click' on any Fuchsia underlined name will take you to that page).
There are a number of types of direct Radio Coverage plots, plus a 'Route Radio Coverage' feature, and two ways to 'Find Best Sites' for communication. This is where locations capable of providing Radio Coverage to a number of selected Units, or to all the Waypoints generated by the 'Object Editor' on a Route, can be plotted. (Use Up or the Back button to return to this page).
In the following plots, the fixed unit(s) and mobile unit - whose parameters are to be used as the receiver - have to be selected. You also have to decide on the Units of measurement and range of signal levels to be displayed, plus the maximum Range to be plotted. It should be noted that the display generated for a Fixed Unit 'Gain' antenna is as if that antenna was pointed towards a particular azimuth, and with a defined antenna Elevation tilt - it can be set as a link direction or defined in degrees, i.e. its radiation pattern and direction does apply to the plot. The antenna pattern can be shown on the plot by checking 'Draw' which creates a small drawing of the antenna pattern overlaid at its location aligned with its azimuth. Clicking on the View pattern button opens the Pattern Viewer which gives a display of the Azimuth and Elevation parameters of the antenna. The mobile unit however is treated as if it has an 'Omni' antenna, even if in fact a 'gain' antenna is specified in its System. The effect of this is to simulate a gain antenna at the mobile Unit which always points towards the Fixed Unit for every location. It should also be recognised that a 'mobile' unit has to be specified for the Field Strength plots, where its antenna height is taken into consideration as the unit is moved.
Note:- With these descriptions, a 'mobile' unit is one which is being moved during the plots - a Unit called 'Mobile', with a capital 'M', is a named and specified Unit as part of the Base Network Membership.
Click here to see Signal Plot type descriptions. Click here to see how to change the Signal Plot legend location. Click here to see how to change the Colour Pallet for plots. Click here to see how to change the Colour Legend steps and omissions. Click here for notes on Single Colour plots with customised scaling. Click here for notes on gain antenna patterns. Click here for a full description of the Antenna Pattern Viewer. Click here to see how to produce a Blank white screen for Coverage plots. Click here to see the Unit description pane. Click here to measure the distance from a Unit to a map location.
Mouse click shortcuts:
To see the Unit description pane go here.
An additional feature has been added which allows distance and bearing data to be displayed from a Unit location:-
Where a Single Unit has been selected using 'SHIFT-click' on its icon, a 'SHIFT-click' anywhere on the picture produces a volatile 'yellow/black' Azimuth line between the Unit and that location.
The Azimuth and range to the point from the Unit being reported on the main window Status area as an additional measurement tool. This feature can be seen here.
Click on the underlined Fuchsia title to go to the page:
Please note that on all the coverage panes a small icon can be displayed as a reminder of the status of Land cover.
shown as:
(The icon display is controlled by the checkbox 'Icon' on the 'Options/Elevation' pane Land cover tab).
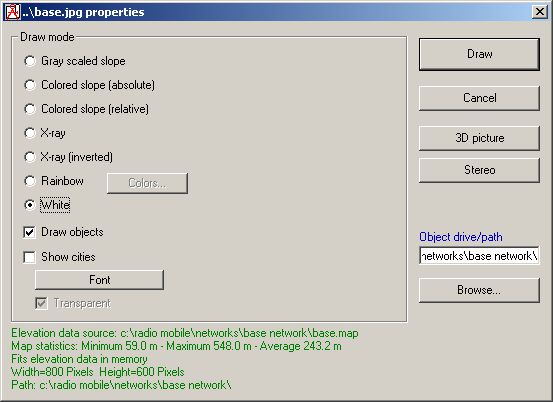
Generating a Blank white screen for Coverage plots : With all these plots it is better to perform them over a greyscale or black/white picture to avoid colour degradation. An even better way is to produce a 'Blank' white picture containing the elevation matrix data for the area for the plot canvas.
This white picture can be
produced very quickly by first opening the map picture of the area of interest,
and then selecting
'File/New picture', or click on the
'New Picture' Icon
Any plots produced over a white picture can be 'Merge/multiplied' over any other picture to indicate the coverage over say a road map of the area whilst retaining the plot for future use. The action of a 'White picture Draw' has to be selected every time it is required as the picture properties pane reverts back to its original settings after use. Your original Map picture can then be reopened after producing a White picture from it.
Note that the losses incurred by the Land foliage coverage can also be incorporated into these plots - to see how, visit:
During plots, the computer CPU load can be reduced by pressing the 'S' key to slow down processing, or paused using the Space Bar - these actions are reported on the lower data area of the main window.
Plot Signal Strength Legend location :
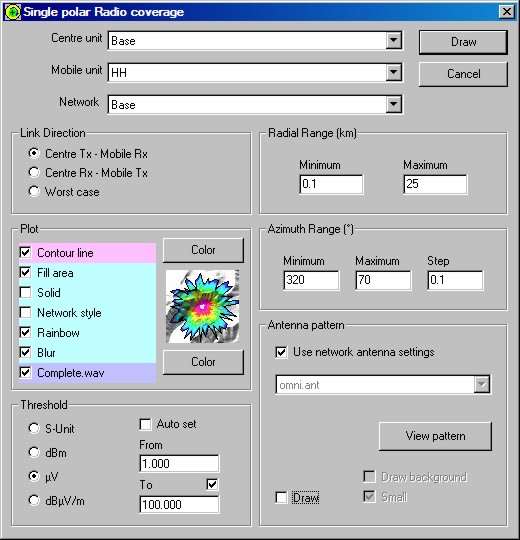
The signal strength legend is visible and placed in the Top Left corner of a plot by default. If you wish to change its location - or not have it displayed - open the Single Polar Radio coverage pane.
This pane is where the details of the plot to be drawn can be seen.
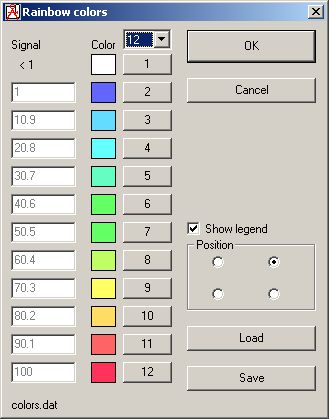
When Rainbow colours are selected in the Plot area, a left click on the Colour button adjacent to the 'Fill area' produces another pane where the displayed colours may be changed and signal level ranges examined. At the lower right of this pane is the area controlling the legend position, with a check box to disable it.
Default File - Colors.dat
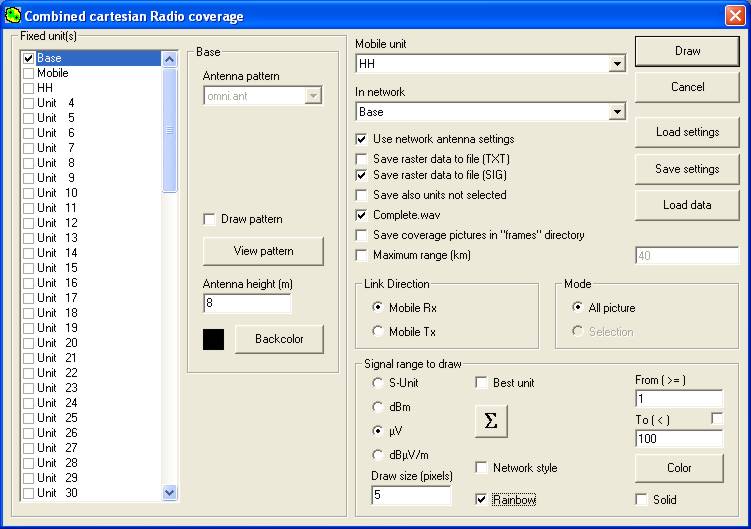
Similarly for Combined Cartesian coverage, where the pane below is displayed:
A click on the Colour button in the 'Signal range to draw' area, when Rainbow colours are selected, then produces the same Rainbow colours pane as above, with the legend location being selectable.
Note: Checking the 'Completed.wav' box on the above pane causes the computer to generate a 'Plot complete' sound when the plot generation is finished. This is a very useful feature where multi-unit high resolution plots are being performed as they can take a considerable time to complete. It is also useful to be able to use the 'S' and Space bar features Here to control CPU usage during the task.
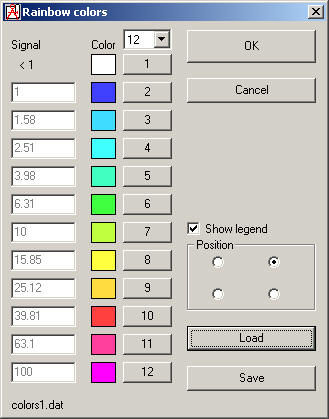
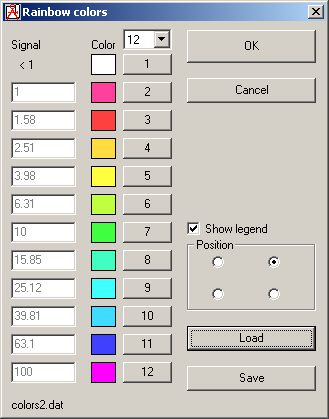
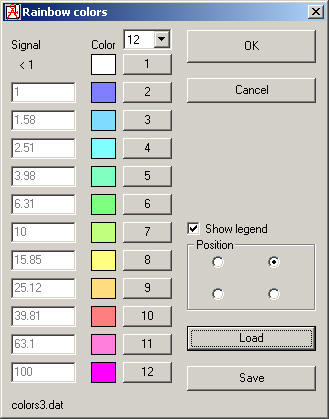
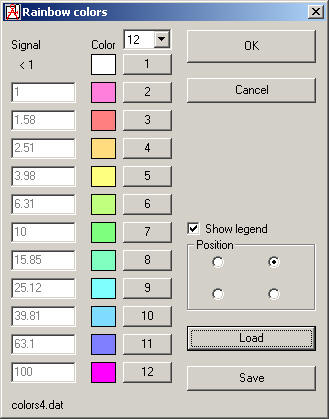
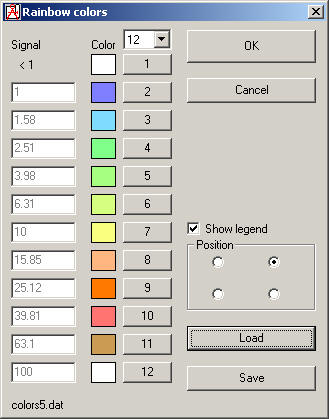
Changing the Colour pallet for plots: When the Rainbow Colours pane is open, a click on the 'Load' button will open a browse pane showing the RM folder and a different Colour pallet can be selected - named 'Colour*.dat' where '*' represents 1 to 5 for the extra five pallets available as shown below.
Colors1.dat Colors2.dat
Colors3.dat Colors4.dat
Colors5.dat
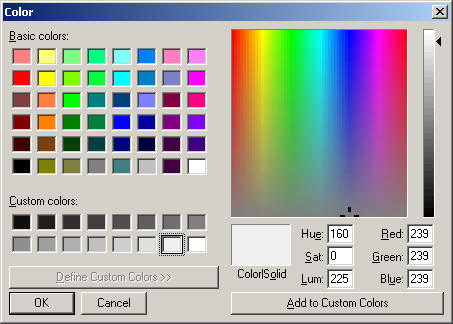
A click on a number by a colour, opens a colour pane which allows the colour to be changed as required. The new colour selection can then be saved for future use by using the 'Save' button.
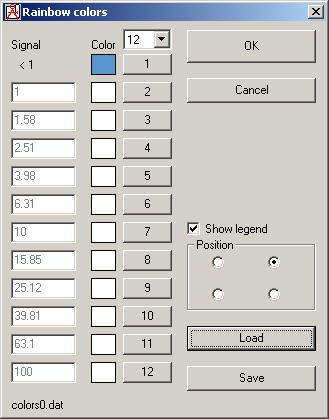
The following 'Color0.dat' has had all colours in the range saved as White, with levels below the range set as Blue. This is particularly useful where a single colour area is required showing that a criterion has been met on the plot. Use of this colour pallet is most useful for the 'Find Best Sites' plot where, for instance, a white area for more than 20% coverage may be plotted, with areas of <20% shown as blue.
Colors0.dat
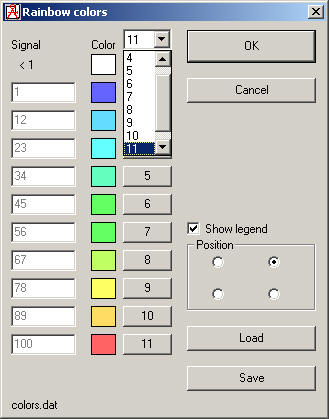
Selecting the colour Legend steps and omissions : A new feature on the Rainbow colours pane is demonstrated below. On the Colors.dat pane shown on the left, the highlighted '12' box can be seen which has a drop down list arrow beside it. The default setting for the number of steps used by the program for the Rainbow plots and also shown on the Legend is 12 steps. By accessing the drop down list this can be varied from 12 to 3 steps as required. The modified version on the right illustrates the result with 11 steps selected which produces integer bands of signal levels. By modifying the 'Signal range to plot' and also the number of steps within that range to be displayed allows the plots and Legend to be customised for your own requirements.
Colors.dat Colors.dat-modified
One further point is that if any colour setting for a legend band is selected as true full 'White' colour it won't appear in the legend or show on plots. I have used this term as with my installer you will find that I have modified any White colours in the colour pallets to be the first grey which is 'almost white' from the colour selection as can be seen below.
Full White selection
'Almost White' selection This modification allowed all the plots to be performed with the 'almost white' colour used and shown on the plots and legend.
In both the Single Polar and Combined Cartesian Radio Coverage panes shown above, Rainbow Colours have been selected for the plot. By un-checking the Rainbow box, a single colour plot can be performed as shown on the Single Polar coverage page. In this case a selectable single colour is used, (in Solid or Transparent form), to show areas meeting the selected signal range criteria. If 'Contour' is selected in the Polar Plot, this coloured line will be placed at the lower signal boundary of the plot. With both Polar and Cartesian plots, a succession of signal range plots can be performed and 'kept in picture' with your own signal range specifications. The only thing that is required for completion is a 'custom' legend. This could be generated in an external photo program - copied - then pasted and saved in the plot produced by extracting it from the RM folder, modifying, and then returning it to the folder.
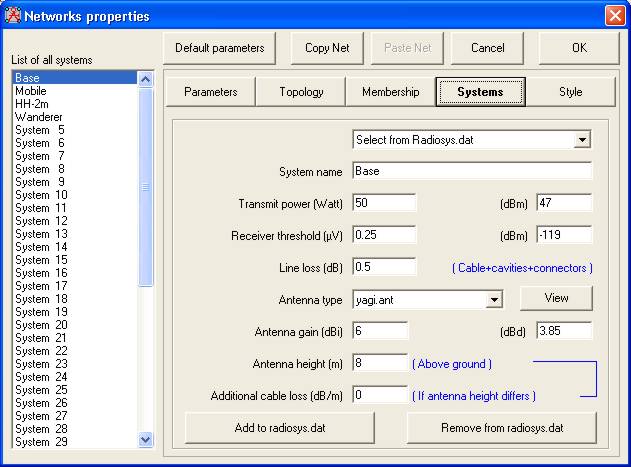
Where a gain antenna, such as the Yagi, is selected in Network Properties for my Base unit System:
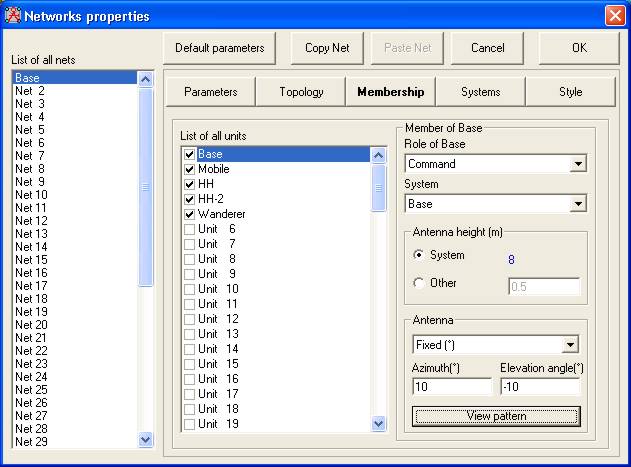
Moving to the Membership pane, and selecting a 'Fixed' antenna, with 10˚ Azimuth and -10˚ antenna Elevation tilt in that direction:
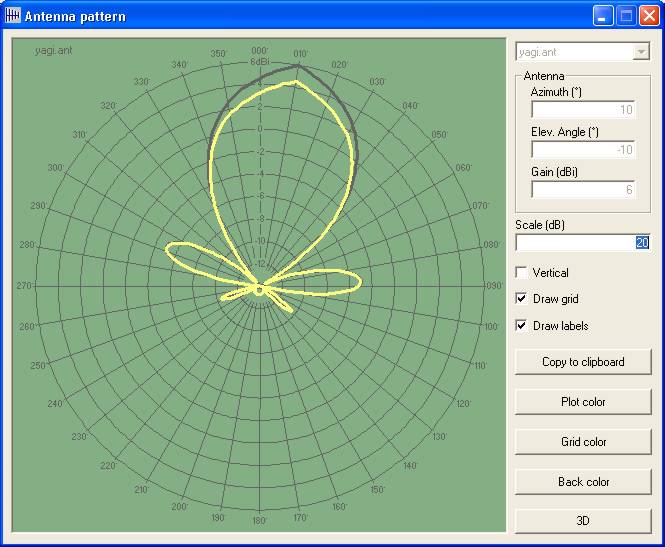
Followed by a click on the 'View Pattern' button, opens the Pattern Viewer pane:
This shows the Azimuth pattern for the antenna in Yellow, with the Maximum gain available for the antenna before tilting in Black.
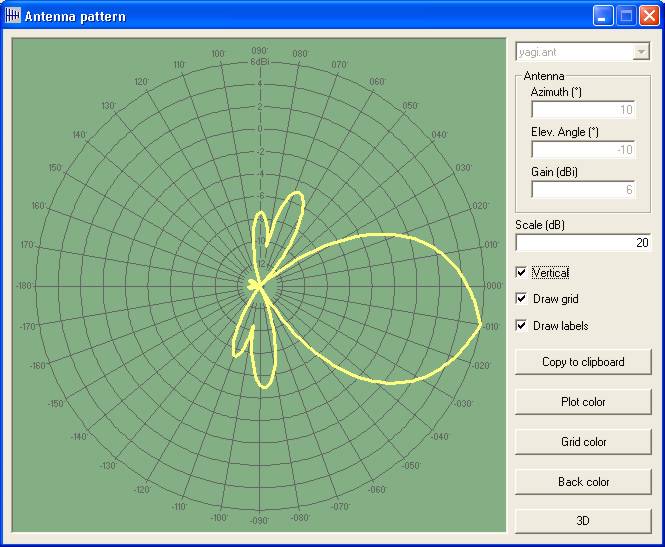
Selecting the Vertical check box, then shows the Elevation pattern for the antenna:
For further information go to the Antenna Pattern Viewer page.
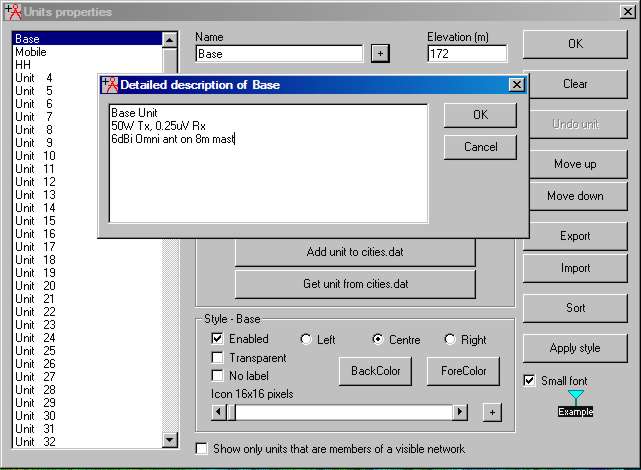
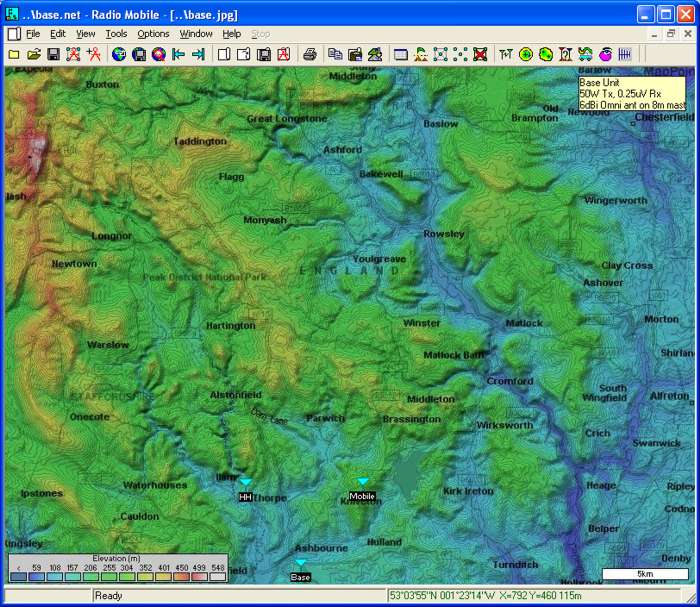
As an additional feature, a click on the + button by the Unit Name on the Unit Properties pane, opens the following entry pane where a description of the Unit can be saved.
The significance of this description pane is that, by performing a 'left click' on the Unit, the description will be displayed on the main screen as shown below. A left click on the description message closes it.
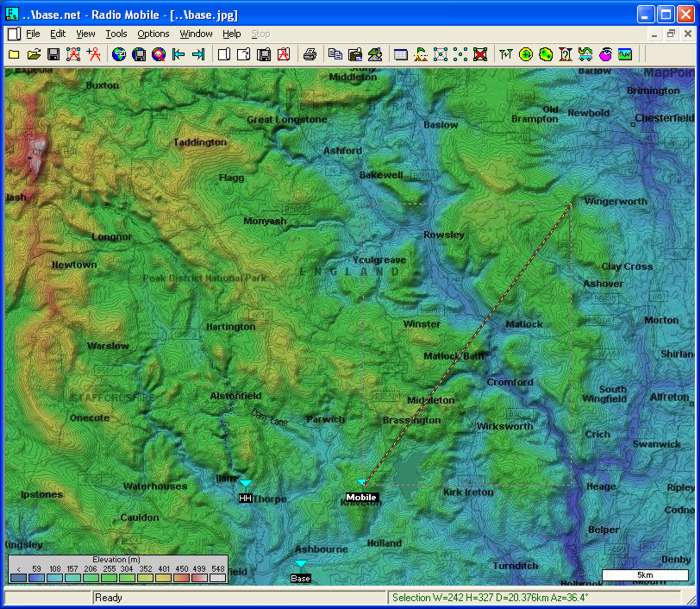
Unit to location measurement :
Where a Single Unit has been selected using 'SHIFT- click' on its icon, (which is then shown in a Bold font), a 'SHIFT- click' anywhere on the picture produces a volatile 'yellow/black' Azimuth line between the Unit and that location.
the Azimuth and Range from the selected Unit to the location are reported in the Status area as seen above.
This page is available in .pdf format here
Please keep checking back for updates/additions.
© Copyright G3TVU 26th October 2017
| |||||||||||||||||||||||||||||||||||||||||||||||
 or 'F3'
 or 'F4'