|
Area |
Usage |
|
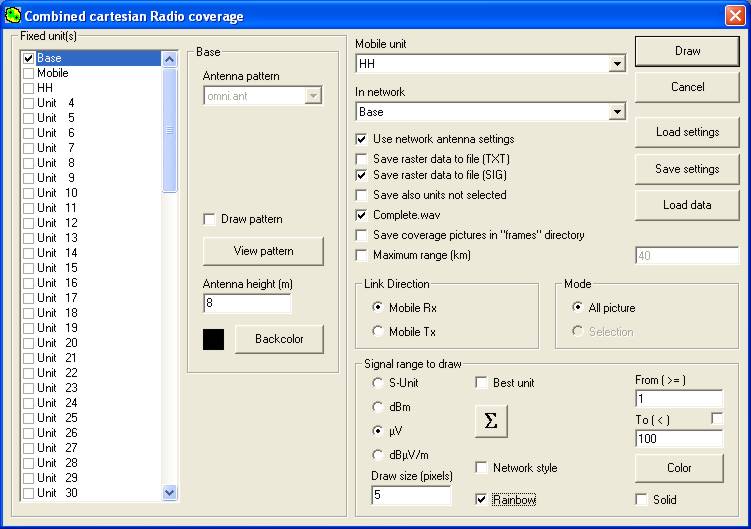
Fixed Units
|
In this area the source Units
for a plot are selected using the check boxes. A single Unit or multiple
Units can be defined dependent on the form of plot required.
|
|
Base
|
This area remains blank until
a mobile (moving) unit and Network are selected
When a Unit is highlighted - as with
the Base Unit above - its antenna pattern is 'Greyed out' showing that
the Network Antenna settings have been selected.
The title indicates the
highlighted Unit. Its antenna pattern is shown with a check box to
enable a small antenna pattern to be drawn round the unit location
during the plot.
A 'View Pattern' button opens
the Antenna Pattern Viewer to enable examination of the antenna
radiation characteristics.
Antenna height can be changed
from the Network settings if required, and the Unit label Background
colour selected for use in 'Best Unit' plots.
|
|
Mobile Unit |
The defined 'mobile'
unit is the unit whose characteristics are moved round the plot whilst
calculating signal parameters. The mobile and all fixed Units have to be
members of the selected Network.
|
|
Draw |
Initiates the plot.
|
|
Cancel |
Cancels the plot.
|
|
Load settings |
Opens a browser pane to load
previously saved Coverage (cov) file.
|
|
Save settings |
Opens a browser pane to save
the current settings in a Coverage (cov) file.
|
|
Load data |
Opens a browser pane to load a
***.txt data file from previous Best Unit plot.
|
|
Use Network
antenna settings |
With this box checked, the
antenna type will be greyed out as shown above, and cannot be changed.
Removing the check from the box enables an alternative antenna to be
selected. With a gain antenna the Azimuth and Elevation of it can be
specified.
|
|
Save raster data
to file (TXT) |
Checking this box enables the
data generated by the plot to be saved to a specified location with your
own name.
|
|
Save raster data
to file (SIG)
|
Checking this box
enables the generation of a ***.sig file during the plotting process.
The 'sig' file contains the signal level data calculated for the plot,
and produces a signal level readout at the cursor position in the lower
data area. This file will be saved with the plot picture for later use
if required.
|
|
Save also Units
not selected |
A check in this box enables
all Units in the Network to be used during the plot, regardless of
whether they are selected or not.
|
|
Complete.wav
|
Checking this box enables a
tone to be sounded when a plot is completed. This is useful where a
small pixel area plot is performed using a number of Units which can
take a considerable time to complete.
|
|
Save coverage
pictures in frames directory |
Where a Best Unit plot is
performed, each Unit is used to perform a separate coverage plot, and
then the final plot uses this set of data to calculate the Best Unit at
each location which is then displayed. Checking this box saves the
individual coverage plots to a selected location from which they can be
accessed later as required. Similarly, with a single fixed Unit the plot
is saved.
|
|
Maximum range Km |
By checking this box the
maximum radial range of the plot can be specified in Km.
|
|
Link direction |
The Radio Link direction can
be specified as 'mobile receive' or 'mobile transmit' for the plot,
where the 'mobile' Unit is the one which has its parameters used as the
moving Tx or Rx unit.
|
|
Mode |
Selection of the whole picture
or a selected area for the plot if a marquee box is on screen.
|
|
Signal range to
draw |
The units required for the
plot from 'S units', dBm, µV or dBµV/m, can be selected. The range of
signals to be shown on the plot being from a defined 'From (>=)'
minimum value to an automatically generated maximum, or by checking the
'To(<)' box, to a defined maximum value. If the 'To(<)' box is not
checked, the maximum value indicates signals > or = to that value.
|
|
Draw size
(pixels) |
A setting of 5 pixels in this
box causes the program to calculate coverage for every '5x5' pixel area
over the plot area. A setting of 1 pixel square takes 25 times as long
to perform than a 5 pixel square plot!
|
|
Best Unit |
Checking this box, with a
number of fixed Units specified, causes the program to perform a
coverage plot for each Unit in turn. These plots are then compared, and
a final plot showing the Unit which generates the strongest signal at
each location is plotted. The Units are identified on the plot by their
label background colour.
|
|
Minimum Signal to
Interference |
This setting only appears
when Best Unit is selected. It allows plot areas to be drawn where a
units signal produces a defined signal margin in dB is achieved between
the specified Unit signal level and all others.
|
|
Style Coverage
|
Checking the 'Network
Style' selection box, removes the 'Range to draw' detail, and a plot
will be performed using the settings and colours selected on the Network
Properties Style pane. The units in a 'SIG', signal level, file
can be selected to enable the actual calculated signals at any point on
the plot to be displayed.
|
|
Σ |
Depressing the Sigma button (Σ)
where a number of fixed units are specified, causes the program to
perform a coverage plot for each unit in turn, and the sum of all
signals are calculated at each location and shown on the final plot.
|
|
Rainbow |
A check in the Rainbow box
will produce a multicoloured display of the signal levels available at
each location. The signal levels are defined in the 'Signal range to
draw' area. If Rainbow isn't checked, a single colour will be used for
the area showing the signal range defined. The colour can be selected by
clicking on the 'Color' button. This feature allows multiple plots of
different signal level bands to be shown on the plot.
|
|
Solid |
A check in this box causes any
colour plots to be performed with Solid colours - this obscures any
background information on the plot.
|