Single Unit Coverage
I can be contacted at E-mail address:-
![]()
Single Unit CoverageI can be contacted at E-mail address:-
|
|
|
A click on 'F4' or the toolbar Icon
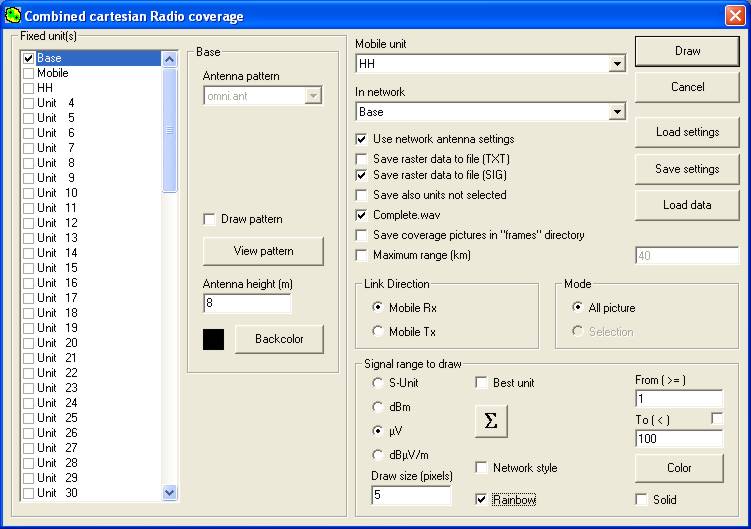
Or by opening 'Tools/Radio Coverage/Combined Cartesian' will show this pane, where one or more fixed Units can be selected for the coverage plot. The antenna details are only displayed when a Fixed Unit, Mobile Unit and Network have all been selected.
The fixed unit and the mobile unit whose parameters are to be used as the receiver have to be selected. You also have to decide on the Units of measurement and range of signal levels to be displayed, (with the maximum Range to be plotted as an option). It should be noted that the display generated for a Fixed Unit 'Gain' antenna is as if that antenna was pointed towards a particular azimuth - it can be the link direction or defined, i.e. its radiation pattern and direction does apply to the plot. The antenna pattern can be shown on the plot by checking 'Draw' which creates a small drawing of the antenna pattern overlaid at its location aligned with its azimuth. The Mobile Unit however is treated as if it has an 'Omni' antenna, even if in fact a gain antenna is specified in its System. The effect of this is to make a gain antenna on the Mobile Unit always point towards the Fixed Unit for every simulated location.
By using the 'Save raster data to file (SIG)' option, a signal level (*.sig) file will be generated during the plotting process. This file then provides a calculated signal level readout at the cursor location for the whole plot. A check in the 'Completed.wav' box causes this sound to be played at the completion of the plot. This is quite useful where a high definition plot is performed which can take a considerable time to perform. At any time during a plot, pressing the 'Space Bar' will pause the calculations, whilst pressing the 'S' key will change calculation rate to Slow, enabling the machine to perform other operations whilst plotting. Both these actions generate a message on the lower data bar. If the 'Completed.wav' box is checked, this will sound as a warning sound at the end of the plot.
A 'Combined Cartesian' plot is performed in an X-Y mode, where the signal at each specified pixel area is calculated and plotted. This means that the resolution is constant over the whole screen area, but calculation time is increased. If a 1200x800 pixel area is plotted at 1 pixel resolution it would require 960,000 calculations - with the 'Find Best Sites' feature this is repeated for each Unit in the network, hence the 5 pixel resolution used for the first rough plot of sites, followed by 1 pixel resolution of a selected area to confirm a site location. Once again, if 'Draw Pattern' is selected, a small image of the antenna pattern be drawn.
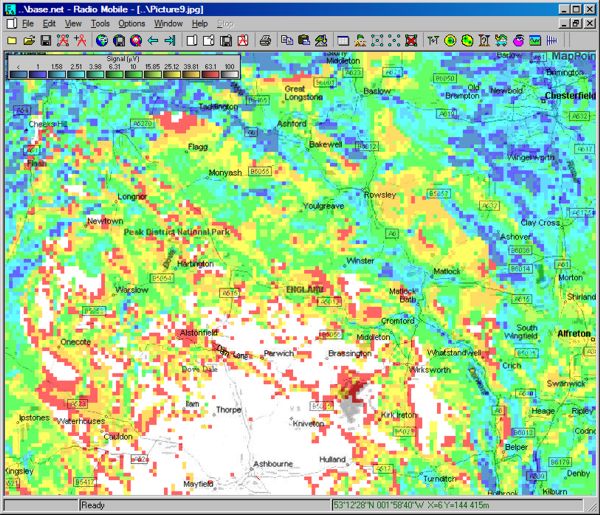
The picture below is the 800x600 pixel Base Cartesian plot at 5 pixel resolution:
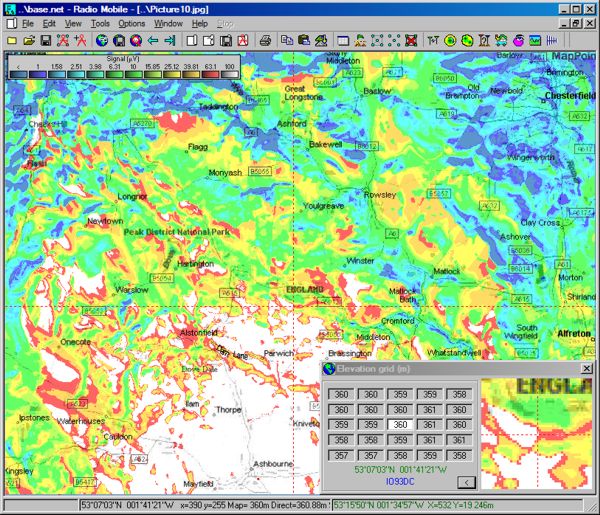
and the following picture at 1 pixel resolution taking 25 times as long to produce:
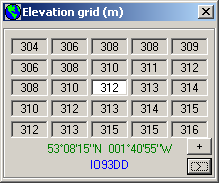
One other feature that hasn't been mentioned is also demonstrated in the pane above. The Elevation Grid matrix has a small > arrow button at the bottom right corner - depressing this opens an observation window as shown which is a magnified view of the screen cross wire area. This allows better positioning of the cross wires on a feature if required. A plus + button can also be seen on the Elevation grid pane below, a click on this places the cross wire cursor at the screen centre coordinates.
In all the Radio Coverage plots, the units can be displayed as required, and the window copied to the clip board by using 'Alt+Print screen'. This image can then be pasted into a photo program to produce the above. As an alternative, if you only wish to show the picture (rather than the whole window), use Edit/copy and then past the picture into a photo program - this will copy links and data paths as well as the above if they are present on screen. The plot is not limited to the whole screen, if an area of the map is selected with the marquee box, (left click and drag), the 'greyed out' 'Selection' button in the Mode area of the setup pane becomes available as an alternative to 'all picture'. This enables a Cartesian coverage plot to be performed on a small area of the screen. (Note that Units for a Cartesian plot can be selected on the map by a 'Shift-click' on the Unit which will then be shown in Bold font).
To see how to relocate the Signal legend click Here
This page is available in .pdf format here
Please keep checking back for updates/additions.
© Copyright G3TVU 26th October 2017
|