Multiple Unit Coverage
I can be contacted at E-mail address:-
![]()
Multiple Unit CoverageI can be contacted at E-mail address:-
|
|
|
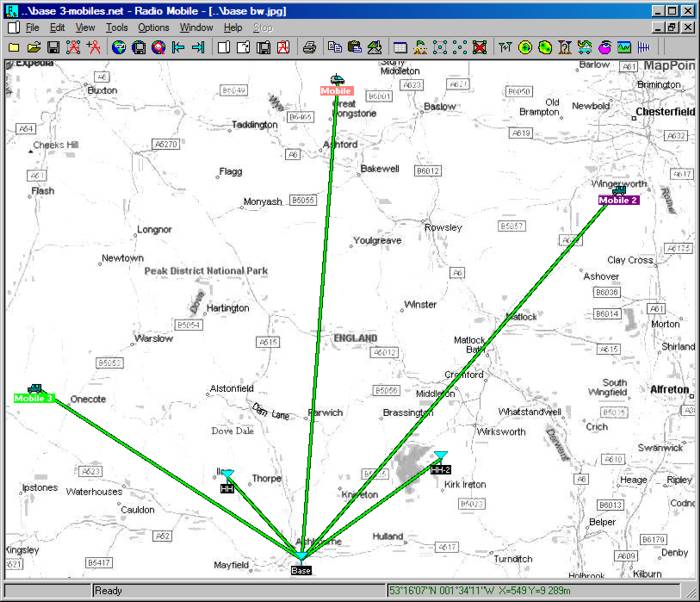
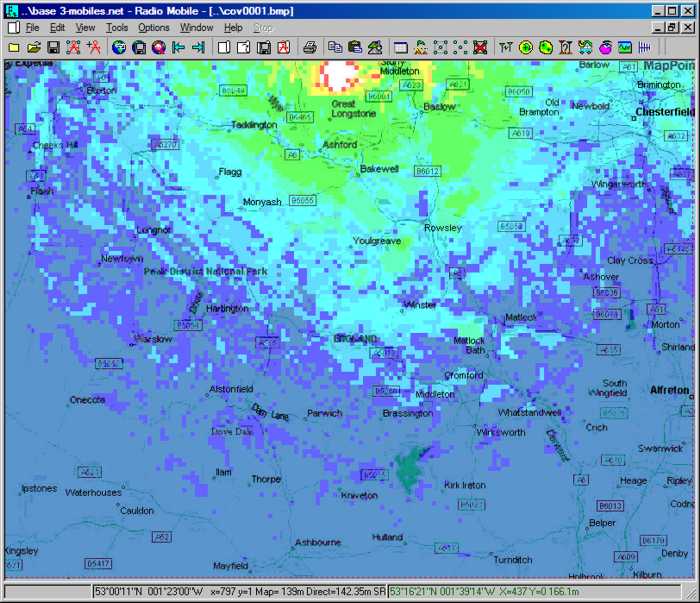
To demonstrate the case where multiple units are selected on the Cartesian Coverage pane, the 'Mobile' Unit from my Base network has been relocated and two additional 'Mobile 2' and 'Mobile 3' units have been positioned on the Base.net road map as below:
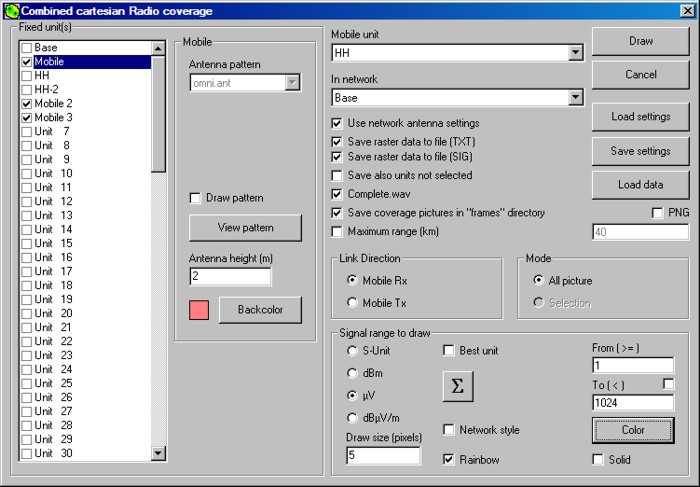
Next, the Cartesian Coverage pane is opened, where the three 'Mobile' Units are selected for the plot, using the Hand Held Unit as the mobile unit (to be used as the moved reference), and the Base Network selected. At this stage it is possible to select the Background colour to represent these fixed units (for Best Unit plots), which is also shown on their labels. The 'Save raster data to file (TXT)' and optionally 'Save raster data to file (SIG)' checkboxes have also been set to make the plot information available later without repeating the calculations, and 'Save coverage pictures in Frames directory' to save the individual coverage plots. The individual plots will be saved in bmp format unless the 'PNG' box is checked - this format is suitable for export to Google Earth from the klm file which is available in the Frames folder generated, as the white background is transparent.
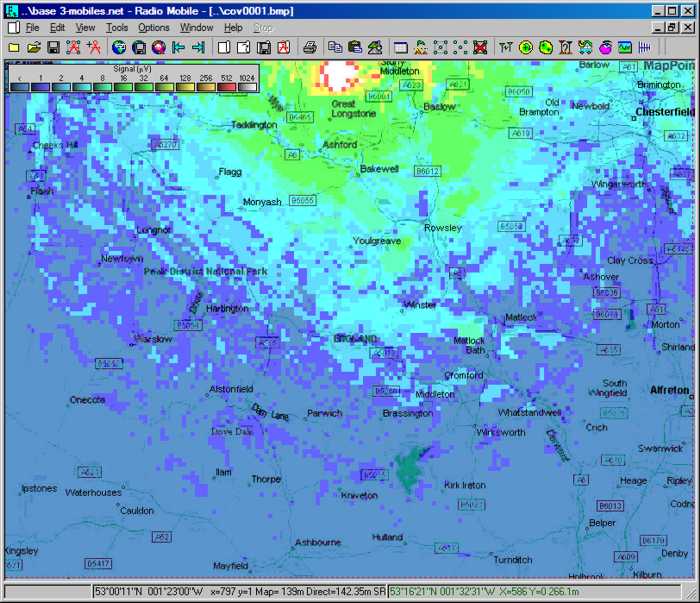
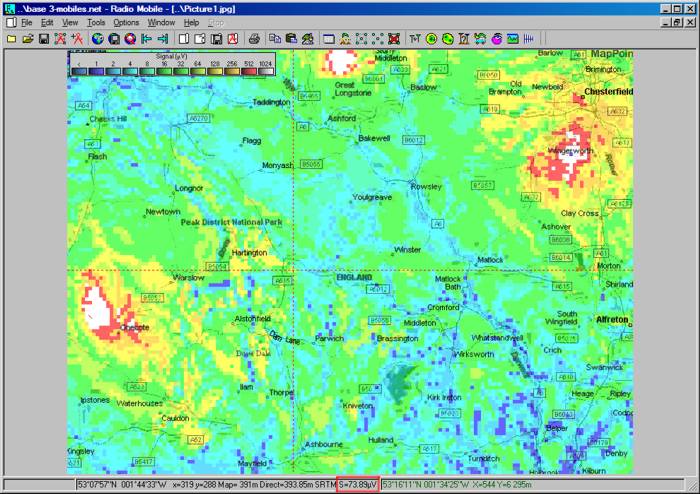
By using the 'Save raster data to file (SIG)' option, a signal level matrix (*.sig) file will be generated during the plotting process. This file then provides a calculated signal level readout at the cursor location for the whole plot. The information location can be seen Here.
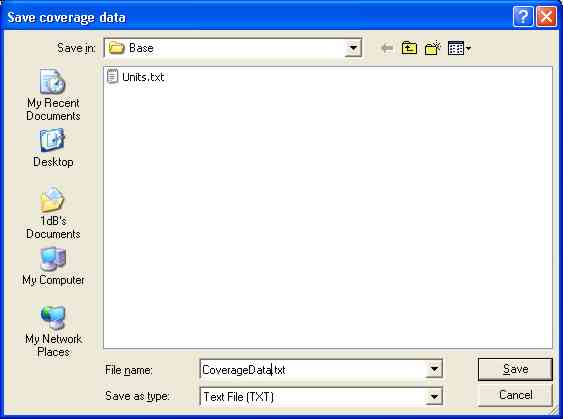
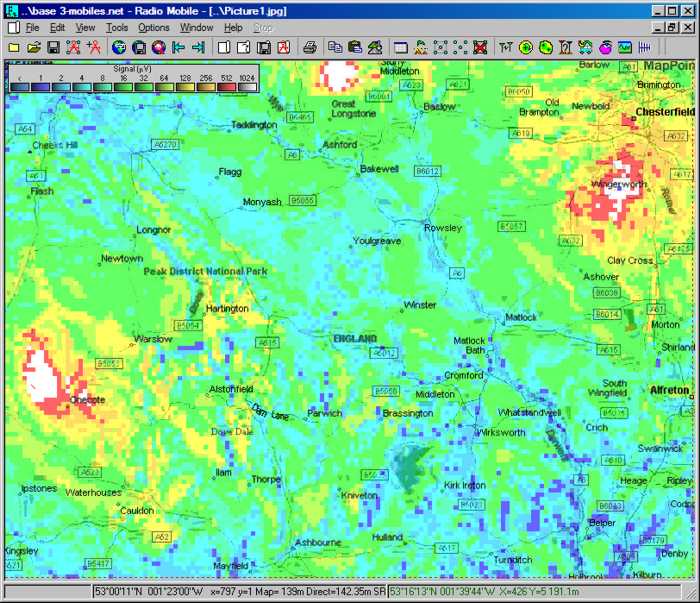
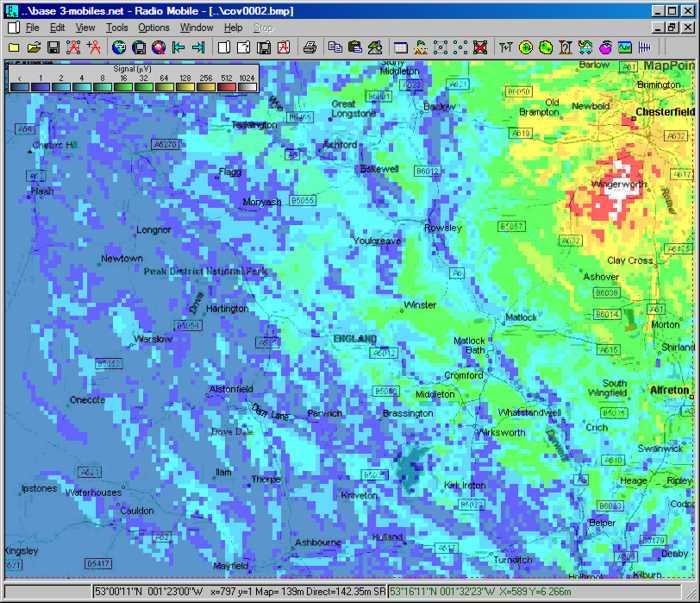
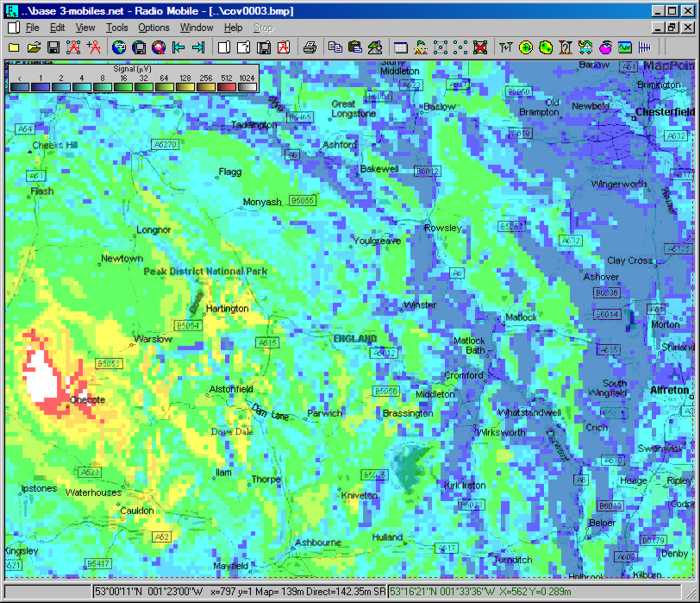
Clicking on Draw causes the three coverage plots to be drawn and saved, plus the 'Combined best signal available' plot which is held on screen and can be saved as a new picture. This prompts the saving of the Coverage Data file to a selected location. These coverage plots will have a *.sig file associated and saved with them if selected. At any time during a plot, pressing the 'Space Bar' will pause the calculations, whilst pressing the 'S' key will change calculation rate to Slow, enabling the machine to perform other operations whilst plotting. Both these actions generate a message on the lower data bar. If the 'Completed.wav' box is checked, this will sound as a warning sound at the end of the plot.
But also see the Best Unit page Next!
This page is available in .pdf format here
Please keep checking back for updates/additions.
© Copyright G3TVU 26th October 2017
|