Cartesian Style
I can be contacted at E-mail address:-
![]()
Cartesian StyleI can be contacted at E-mail address:-
|
|
|
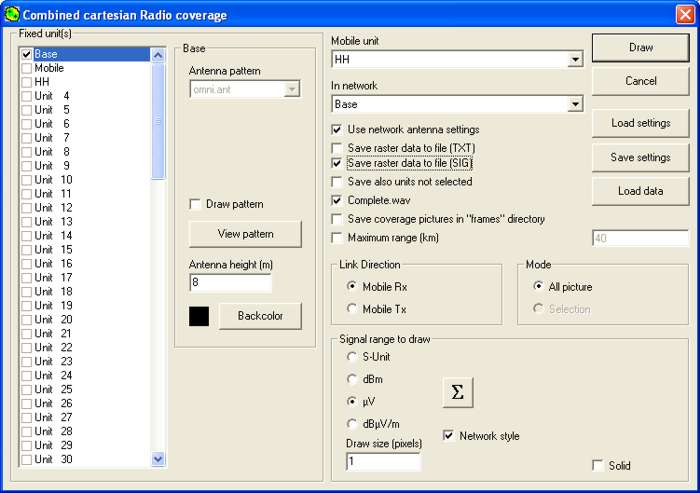
Opening the Combined Cartesian coverage pane using F4, 'Tools/Radio coverage/Combined Cartesian', or by clicking on the
the following pane will be displayed, where 'Network style' can be selected.
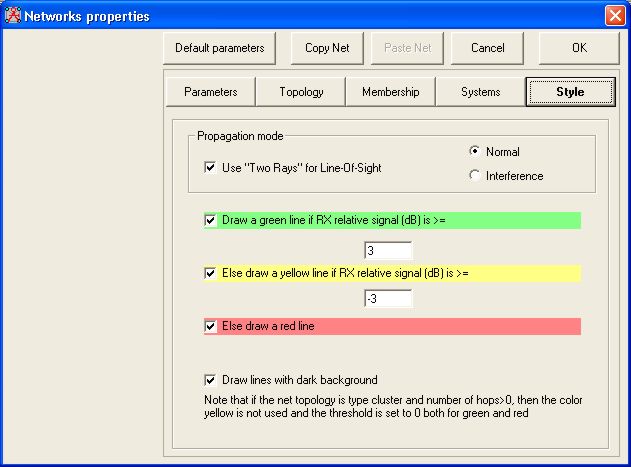
The 'Signal range to draw' selection boxes have been removed, as a 'Network Style' plot generates a coverage plot with signal levels displayed by the colours according to the limits shown on the Network Properties 'Style' tab.
In this case a Green area show signals >= to 3dB above the mobile receiver threshold, with Yellow displayed for the region between +3dB and -3dB, and Red for signals <-3dB.
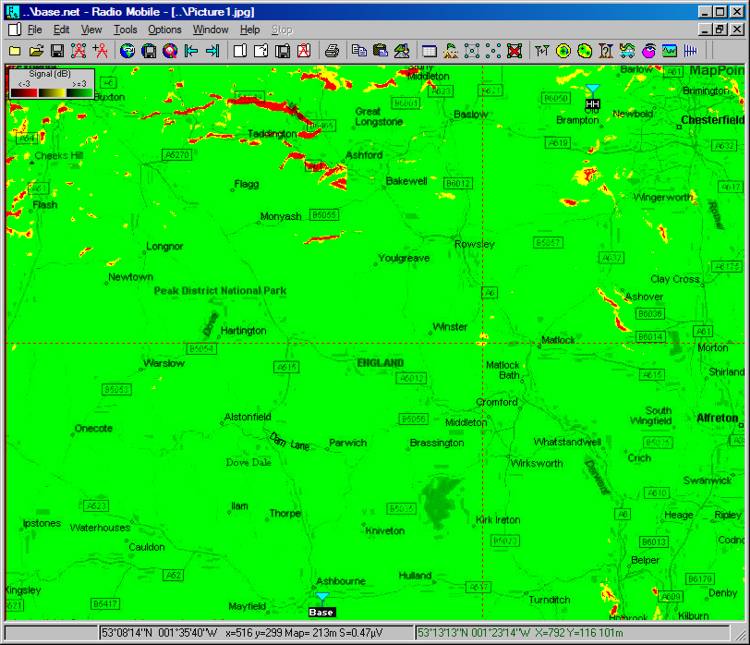
Performing the plot on my Base Network using Base as the fixed Unit and the HH radio as the mobile, generates the screen below, showing areas where communication is not possible:
As the 'SIG' box was checked, a signal file has also been generated for this plot, using the selected µV as the displayed unit. The cross wire cursor has been placed in the small yellow +/-3dB area, and a signal level of S=0.47µV is indicated in the centre of the bottom data area.
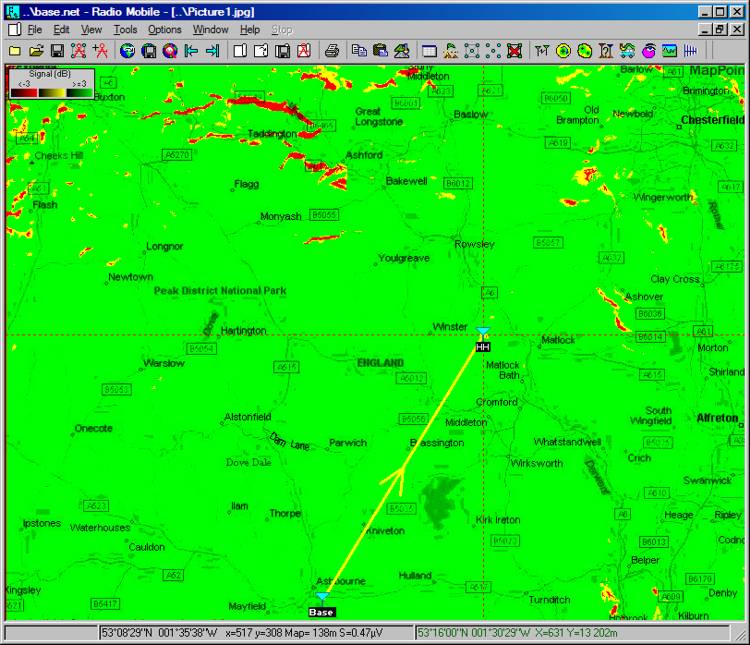
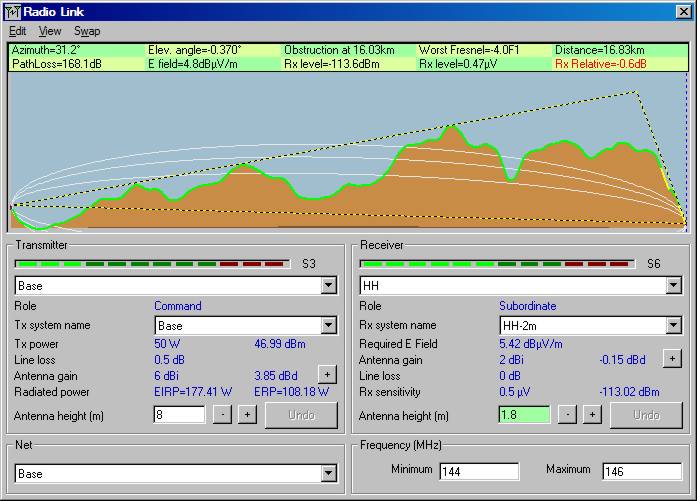
Opening Unit Properties, selecting the HH Unit and placing it at the cursor then produces:
and on opening the Radio Link pane using F2 - or Tools/Radio Link, the signal path is shown in Yellow corresponding to the Style setting, with the Radio Link pane indicating a Received signal level of 0.47µV, which is -0.6dB relative to the receiver threshold.
This page is available in .pdf format here.
© Copyright G3TVU 26th October 2017
|