Land cover
I can be contacted at E-mail address:-
![]()
Land coverI can be contacted at E-mail address:-
|
|
|
Using Land cover data:
World wide Land coverage data is now downloadable from the on-line servers in *.lcv format which is at a much higher resolution than the previous *.img format which has been superseded. The data is saved into the folder at 'C:\Radio Mobile\Land cover' for use by the program. Higher resolution data for North America is also available from the servers in this format.
1) Merging 'Land cover' with pictures 2) Incorporating 'Land coverage' into propagation plots
1) Merging Land cover data with pictures
The Land coverage files are located by my installer in the folder 'C:\Radio Mobile\Land Cover\*.img' which is the default location set on the Land Cover Data Options pane.
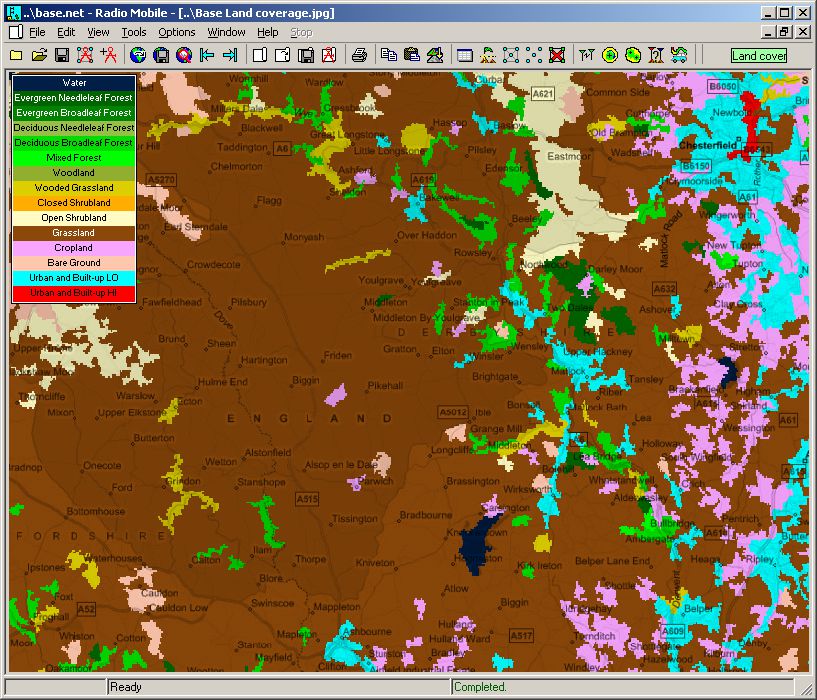
Pressing the 'Draw' button and 'keeping in new picture' will then produce the following plot over the Black/White picture, but see below for a description of the legend:
The improved resolution of the data can be seen when compared with the original *.img data below:
If the Land Cover file isn't present on your machine, you will only see the legend displayed - but if connected to the internet the data will be downloaded and saved for use.
2) Incorporating 'Land coverage' data into Propagation plots
Land cover data can be incorporated into propagation plots, where the length of the radio path impinging the coverage, and the density of the coverage, are both used to calculate the additional path losses incurred.
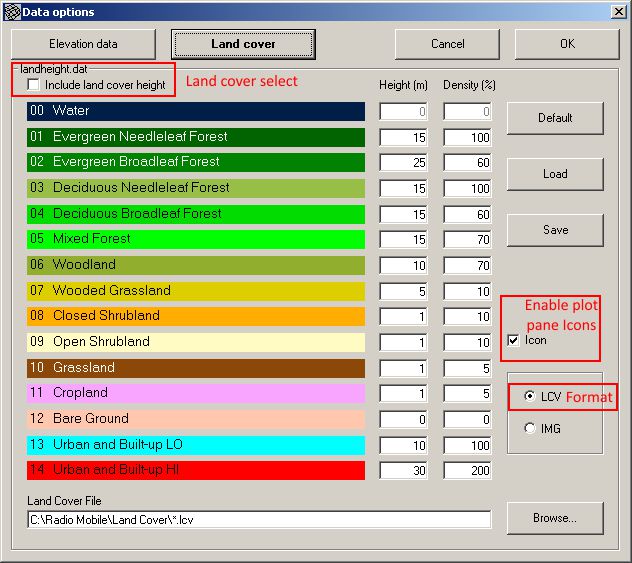
Opening the 'Options/Elevation data' pane, and selecting the 'Land Cover' button produces this pane, where 'Include Land cover height' can be checked to add the data into path plot calculations. It is necessary to 'Browse' to your Land cover data file location at the bottom of the pane to activate this feature. Use of Land Cover in plots can also be controlled by a Toolbar Icon (obtained by a Right Click on the toolbar icon to be selected), as described below. Data in *.lcv format as shown selected in the lower right control area. The 'Icon' check box when enabled produces a small 'reminder' icon on each coverage pane when enabled. This is of use when the Land cover button isn't shown on the toolbar.
shown as:
The colours reflect those shown on the legend in the merged picture shown above. In this pane the heights of the various layers and their RF density value can be adjusted from the defaults shown to meet local requirements and calibrations. These User values can be saved and reloaded as required. It will be noticed that an additional 'Class 14' coverage has been added for high structures.
By opening the 'Toolbar Options' pane (by a right click on the toolbar), a 'Land cover' button can be selected and displayed at the end of the Toolbar. This button will have a Red background if the Land cover is disabled. Where Land cover is enabled for use in propagation calculations the button background is Green. A click on the button will toggle between the Green 'enabled' and Red 'disabled' conditions.
Effects of incorporating Land cover:
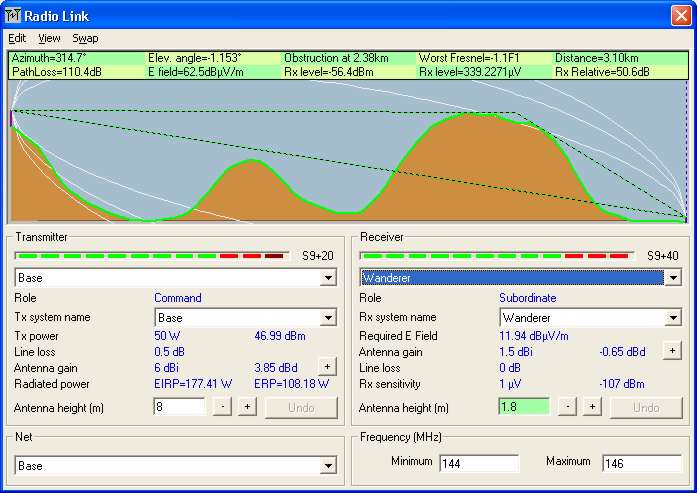
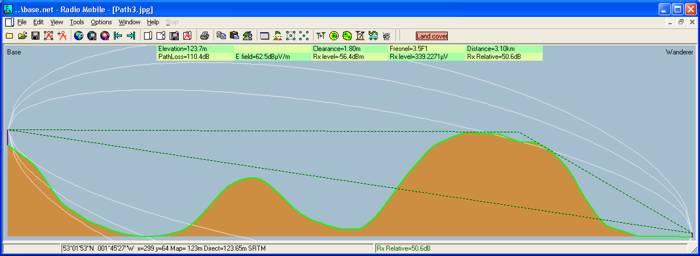
The effect of invoking the Land cover data into propagation plots may be illustrated by utilising this Radio Link pane - in this case Land cover is not invoked:
and the Link details are:
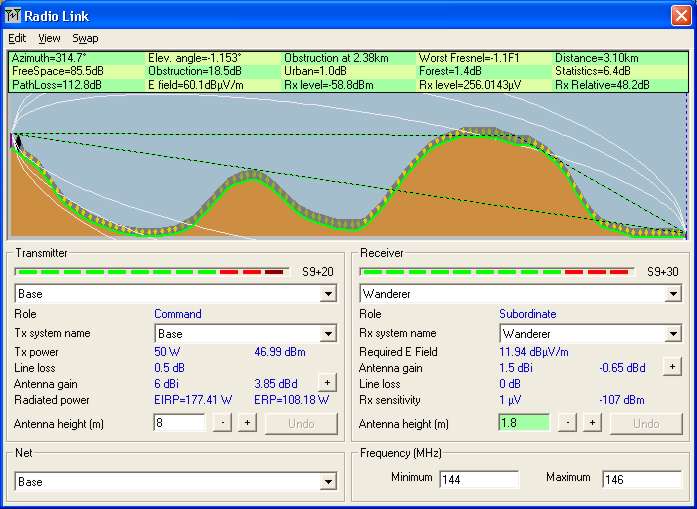
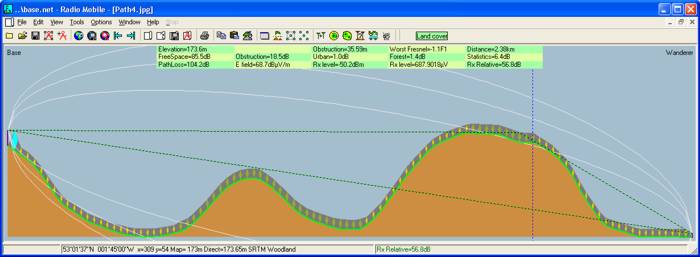
On this second Radio Link pane, Land cover has been invoked and is shown on the ground profile. The added 2.4dB losses are due to the radio path passing through foliage on the top of the second hill, plus the small urban loss near the transmit site.
whilst the Link details show:
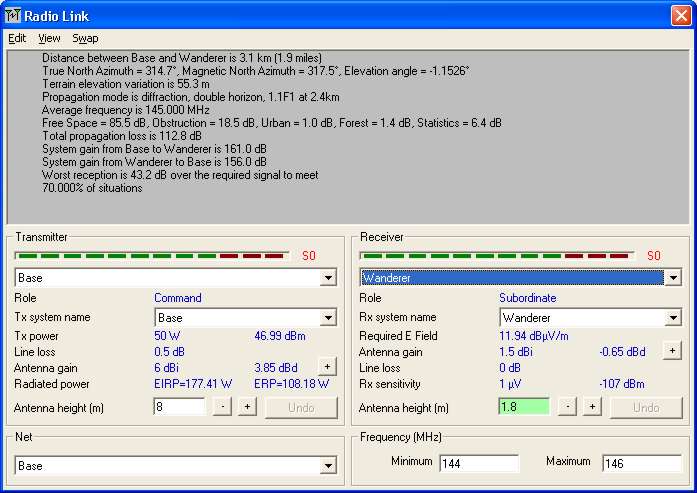
To produce the above screen records, with the pane active, using 'Alt+Print Screen' will place a copy of the pane picture on the clipboard for insertion into a photo program. As an alternative, where only the path details are required rather than the full 'Radio Link' pane, using 'View/Large window' produces a large window of the path on the main program screen. This can then be saved to the clipboard using 'Edit/Copy'.
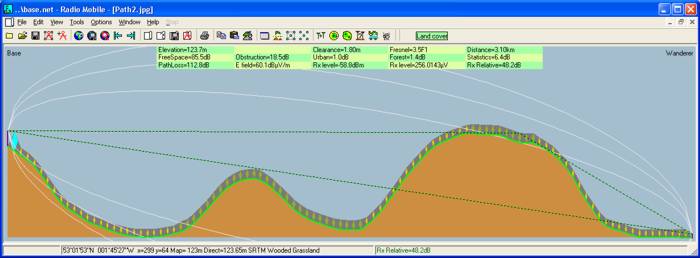
Placing the cursor at an intermediate point on the Radio path, and saving the Large window as above, shows the link details and the type of Land cover at that point in the bottom data region of the window.
However, if Land Cover isn't invoked, the details of the additional losses aren't displayed.
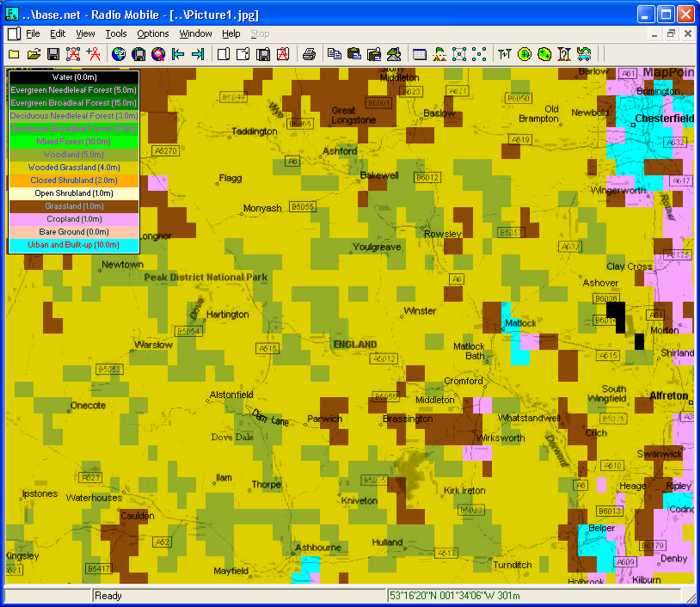
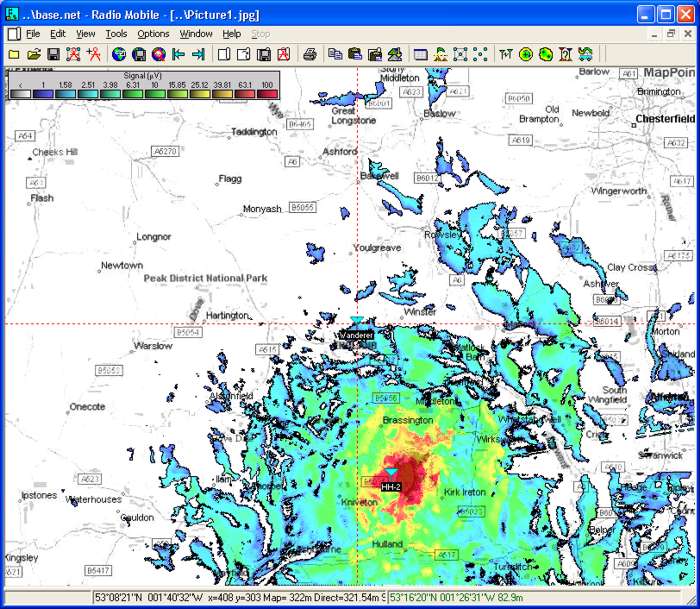
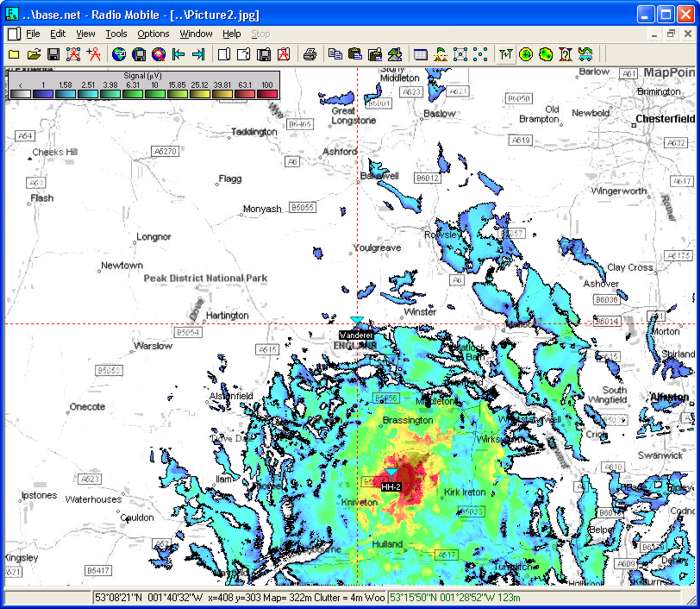
The effects of using Land cover can be seen by comparing the following Polar plots between two low power units. This first plot (Picture1) has had land cover disabled, whilst in the plot below (Picture2) Land Cover is enabled and a description of the coverage type at the cursor location indicated in the lower left data area.
These plots can be compared directly by passing your mouse pointer over Picture1 to replace it with Picture2.
Whilst the second plot below, with the same settings, has land cover enabled:
Comparing the 1μV boundary of both plots, shows the reduced area of coverage when applying the additional Land coverage losses.
These are Roger's notes relating to the use of Land cover.
This page is available in .pdf format here
© Copyright G3TVU 26th October 2017
|