Visual Coverage and Horizon
I can be contacted at E-mail address:-
![]()
Visual Coverage and HorizonI can be contacted at E-mail address:-
|
|
|
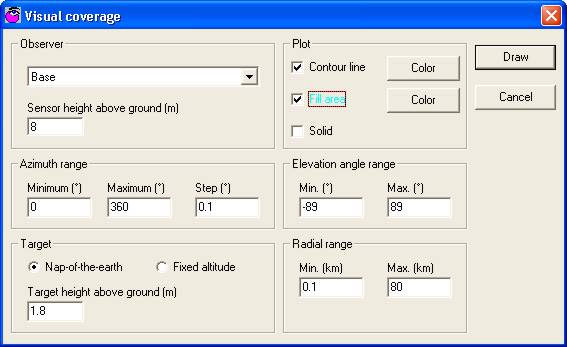
A Visual coverage plot may be performed by using 'F11', opening 'Tools/Visual coverage', or by clicking on the Toolbar Icon:
This will open the pane below where the Observer Unit can be specified, and the height above ground level from which to perform the visual plot is selected. Here, it is also possible to define the height above ground level of the Target, which has been set at nominal 'eye level' in this case. For this plot 'Nap of the earth' has been selected to show an actual visual range over the elevation map. Selecting 'Fixed altitude' changes the target height to that Above Sea Level.
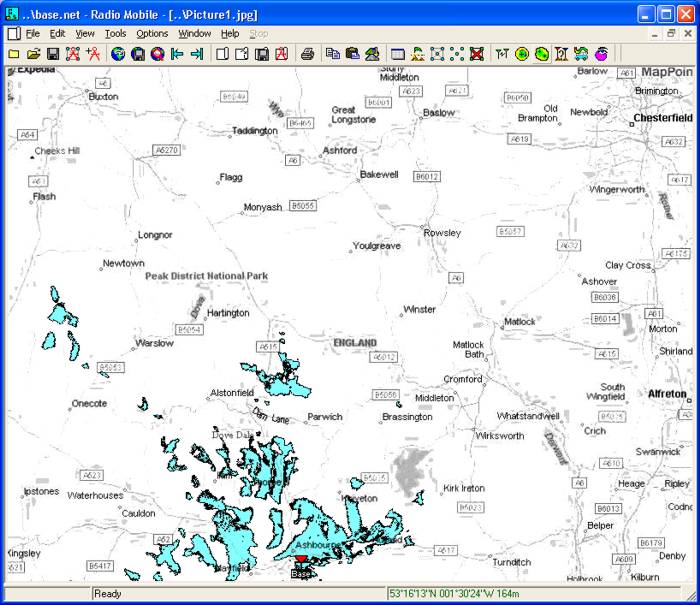
By using the full elevation angle range, all points visible will be displayed over the selected Azimuth and Radial ranges. The Plot has Used transparent Blue as the area fill to allow the road map details to show through the colour, and a black contour line to define the limits, which produces the plot below.
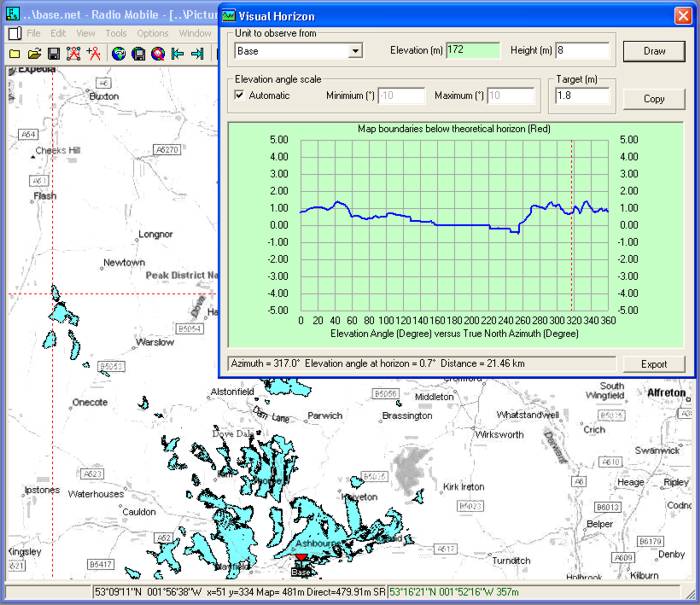
An additional feature available is the 'Visual Horizon' pane - this is accessed using 'F12', via 'Tools/Visual horizon', or by clicking on the Toolbar Icon.
After selecting the 'Unit to Observe from', and the height of observation plus the target height, clicking on the Draw button produces the following plot.
The plot shows the elevation angles against the True North azimuth angles of the Visual Horizon, whilst the data area at the bottom of the plot gives details and distance of the horizon at any azimuth. The cursor can be placed with a mouse click, or moved with the arrow keys. The actual point indicated on the pane is also reflected on the main screen as shown by the cursor cross wires.
This page is available in pdf format here
© Copyright G3TVU 26th October 2017
|