Network, Radio Link and Route Styles
I can be contacted at E-mail address:-
![]()
Network, Radio Link and Route StylesI can be contacted at E-mail address:-
|
|
|
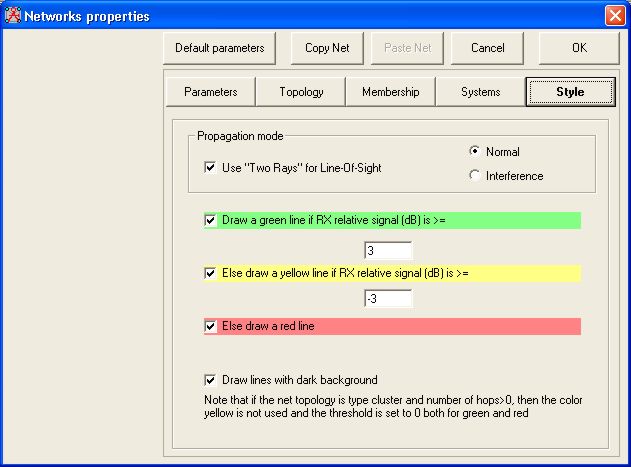
The Style pane is accessed from the Network Properties pane below, (File/Network Properties), Ctrl+N, or by a click on the toolbar icon:
A click on the Style button shows the definitions selected for the Network, Radio Link, and Route signal path displays, where a +/-3dB signal level relative to receiver sensitivity is selected as a Yellow line. Signals >3dB being shown in Green, and <-3dB shown as Red. When a 'Cartesian 'Style plot' is performed, the plot resulting utilises the colours and settings set on the Style pane to show areas corresponding to the calculated signal levels which can be seen Here. A Polar 'Style plot' is shown Here for comparison.
The check boxes adjacent to the coloured lines define whether a Network display shows these colours on the plot - i.e. only Green signal level links could be selected showing signals links >+3dB above the receiver threshold only, using the settings below. Changing the level (dB) settings, alters the threshold colour line plots for the Network, Radio Link and Route panes, and also the drawn Route - Note that the check box colour selection doesn't apply to these plots, only the Network plot! With a Network, Radio Link and Route plot, the Yellow overlay colour can be removed by selecting the same level in the two 'dB' boxes, to give a display with Green and Red plots only.
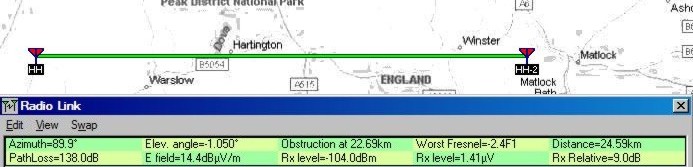
The Network path plots themselves also give an approximate indication of the approach to the 'Style' signal level boundaries. These are illustrated in the following link plots, where the Radio Link parameters are also shown with the signal levels relative to receiver sensitivity. The actual thresholds of the changes are dependent on the radio path length and parameters, so are only illustrative.
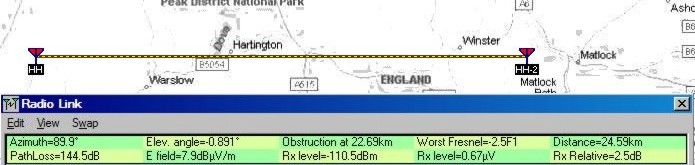
This first plot shows a broad green line present with a 9dB or greater relative signal level:
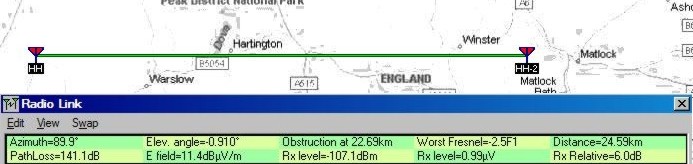
The displayed line reduces in width when the signal level falls to 6dB relative signal level:
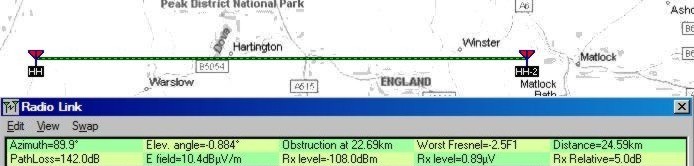
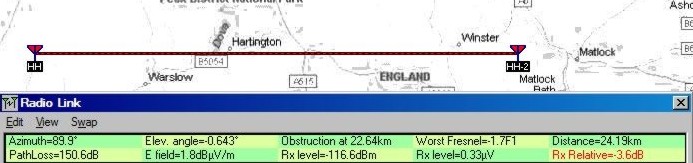
Whilst the line format changes to dashed narrow at 5dB relative signal level:
At 2.5dB relative signal level, the line changes colour to narrow Yellow dashed:
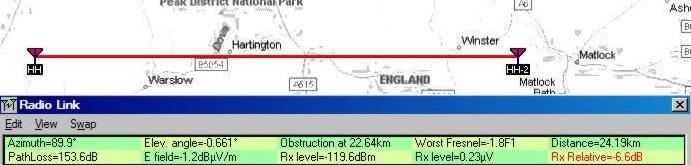
Then the colour changes to narrow red dashed with -2.5dB relative signal level:
The final transition to a solid red line then occurs at -6.6dB relative signal level:
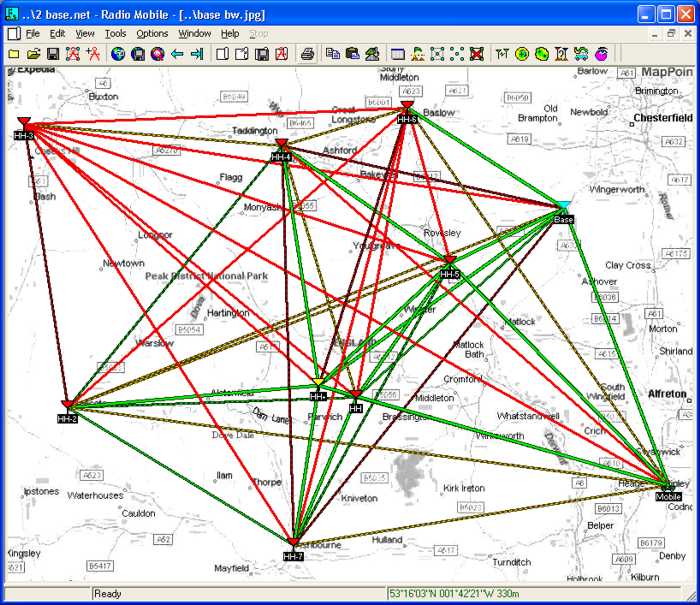
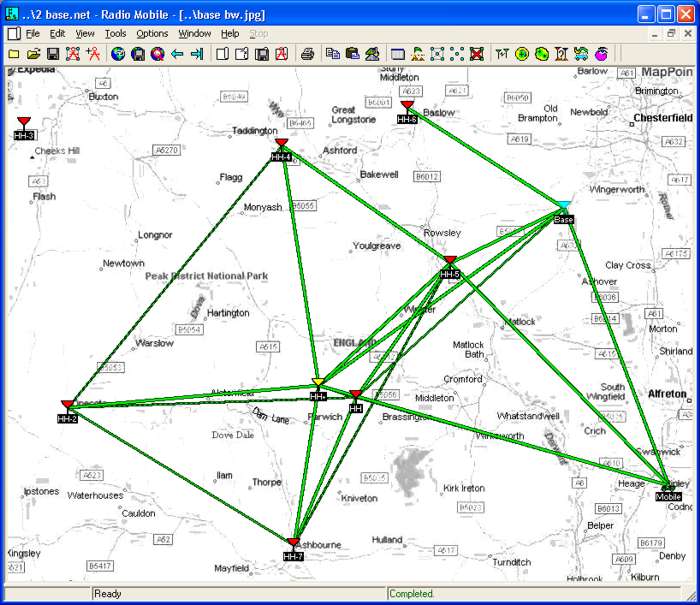
As a demonstration of the effects on a Network display, a number of Units have been placed on a UHF version of my Base Network below. These units have all been set to be Rebroadcast, to make every unit link to every other one as in a data network. The different network path formats as above can be seen.
It can be seen that links are shown in Green, Yellow and Red, which correspond to signal levels >+3dB for Green, +/-3dB for Yellow and, <-3dB for Red links. This is the case where all colours are selected on the Style pane as above.
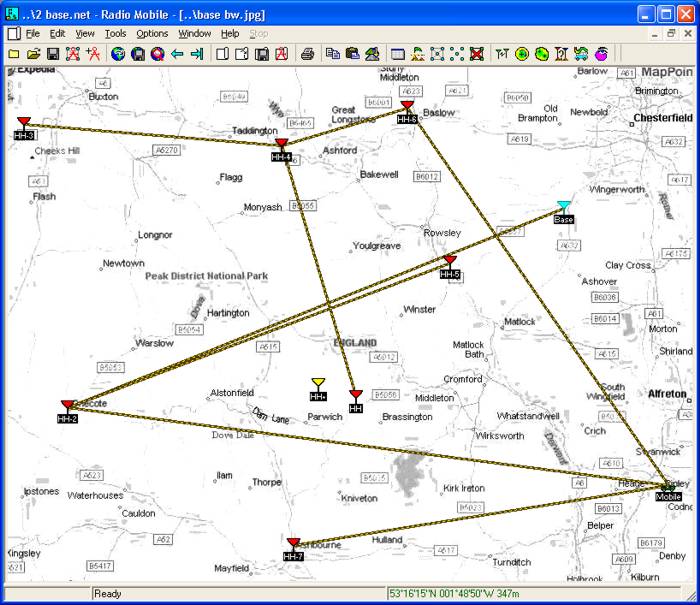
Selecting the Green check box only, changes the display to just show Network signal levels which are >3dB above their receiver thresholds - a much less cluttered display.
Whilst selecting the Yellow checkbox only, makes the Network display show only signal paths with signal levels between +3dB and -3dB on receiver threshold levels.
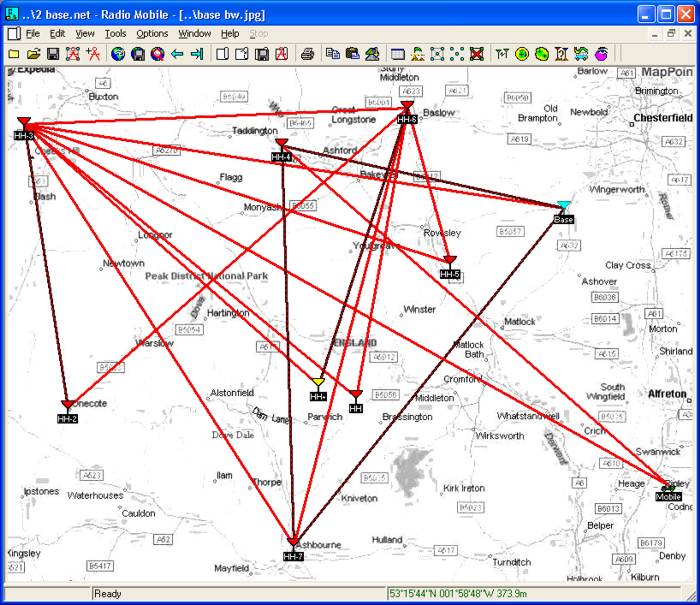
and selecting the Red checkbox only, makes the Network display show only signal paths with signal levels less than -3dB on receiver threshold levels.
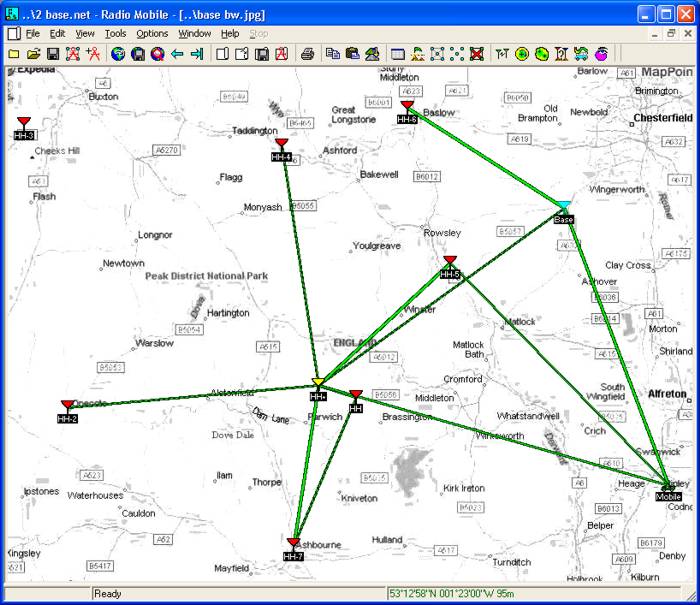
Changing the threshold settings to +15dB and 0dB with Green colour selected, changes the number of links shown to those with the greater threshold. This can be useful to explore data paths requiring a higher signal threshold capable of higher data rates.
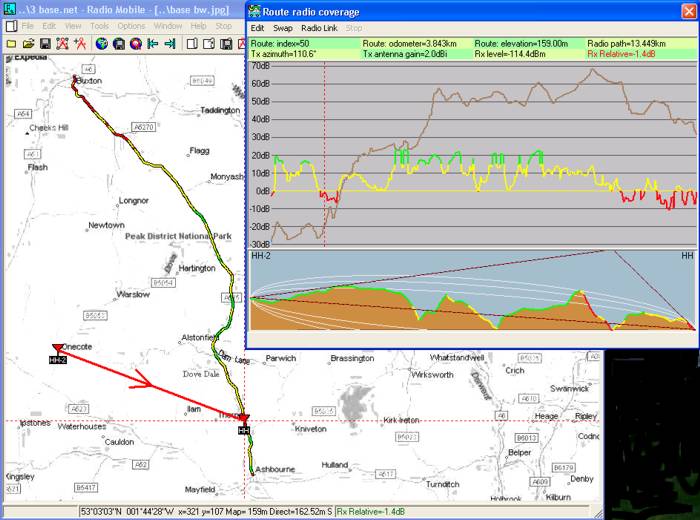
With the above setting of +15dB and 0dB thresholds - and Green only selected for Network displays, a Route can be drawn. This clearly shows the changed colour threshold levels, with all colours being shown on the path signal strength plot when compared with level scale on the left axis.
Note that the Network colour selection check boxes have no effect on these displays!
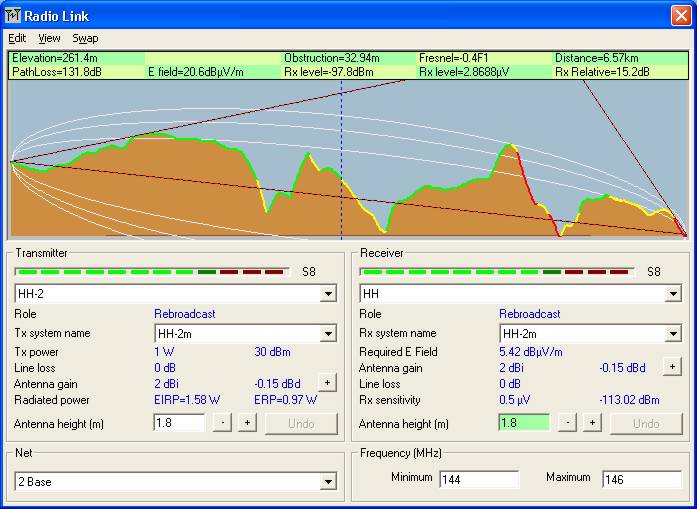
The corresponding Radio Link for the path above is shown, with the cursor slightly above the threshold of the Green and Yellow regions - showing a relative signal strength of 15.2dB above receiver threshold at that point.
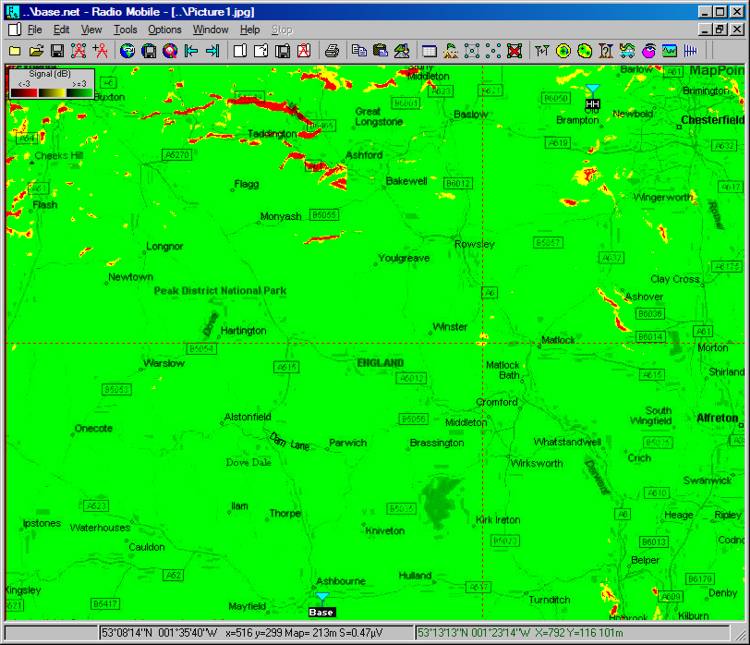
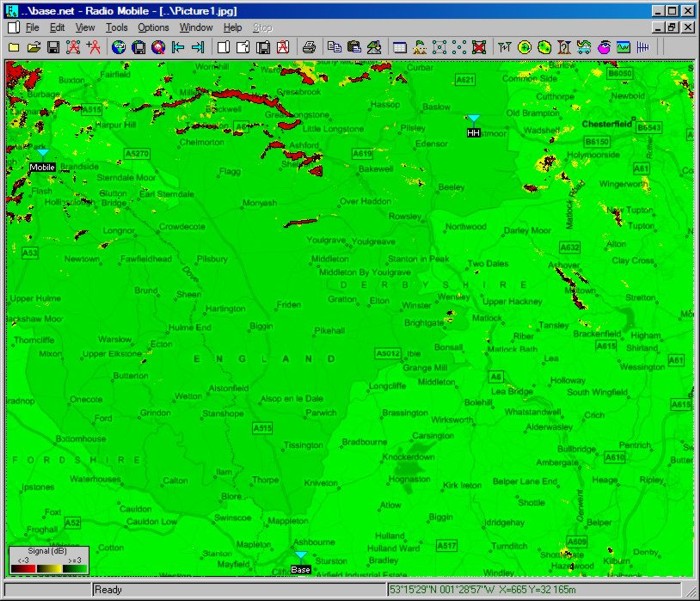
Cartesian Style plot: Where a Cartesian Style plot is performed using the Base Unit as centre and the HH Unit as the mobile, the plot below is generated. The actual Style settings are shown on the legend, and in this case the SIGnal file had been enabled using previously set µV as the units to be displayed. The cross wire cursor has been placed in the Yellow +/-3dB region of the plot, and the calculated signal at that point is shown as S=0.47µV in the bottom data area.
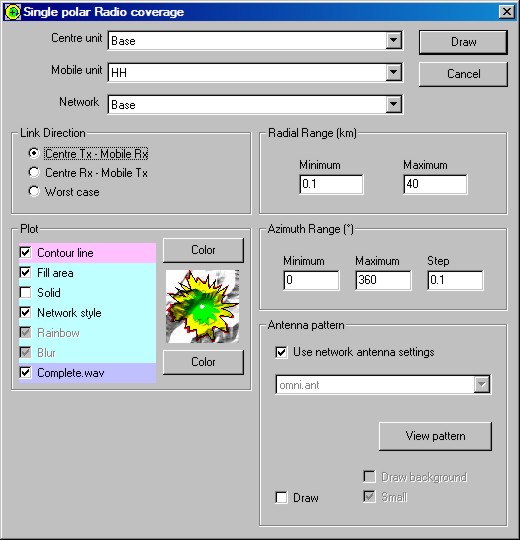
Polar Style plot: Opening the Polar plot pane (F3) and selecting 'Network Style' produces the pane below where the Signal Threshold area has been hidden as the signal levels for the display are set on the network Style pane relative to receiver threshold.
Pressing the Draw button then produces a Style plot as below.
Comparing this plot with the Combined Cartesian plot, it has to be remembered that although the plot is produced much faster, that the resolution is much worse at the edge of the plot than near to the central unit. There is no 'SIG' file available in this mode as the calculations are performed over degree wedge polygon areas.
As a final reminder, if it is required to only show Green and Red colours on the plots without the Yellow region, this may be achieved by setting the two signal threshold levels to the same value on the Style pane.
This page is available in pdf format here.
© Copyright G3TVU 26th October 2017
|