How to..
I can be contacted at E-mail address:-
![]()
How to..I can be contacted at E-mail address:-
|
|
|
This Page is intended to provide information on things not covered - or which could be missed - on my other web pages!
My Radio Mobile Illustrated Handbook... 350 pages of reference and 'How to' data in 19 chapters. Click here for more information!
y con un 10% de descuento si usted compró una versión en idioma inglés.
Also just released: the Radio Mobile Handbook Companion 184 pages of illustrated Tutorial text. This takes you through the Handbook chapters by using supplied Networks with descriptions which enable you to generate all the plots shown in the Handbook! Click here for more information!
Reconfiguring the Base Network to your own location Repositioning Elevation and Data Legends Selecting colour legend steps and ommisions Click here to see how to change the Colour Pallet for plots. Changing Radio Link and Route plot colour thresholds using the Style pane Generating Antenna Radiation Diagrams UK National Grid and Irish Grid Reference Converters Icon shortcuts from the Toolbar
Showing icons for multiple units at a single location Program Help Files (use your browser 'Back' button to return) Increasing the number of Units, Systems and Networks available
Repositioning the Elevation and other Data Legends
Elevation Data: The elevation data legend is visible
and placed in the Top Left corner of a map by default. If you wish to change
its
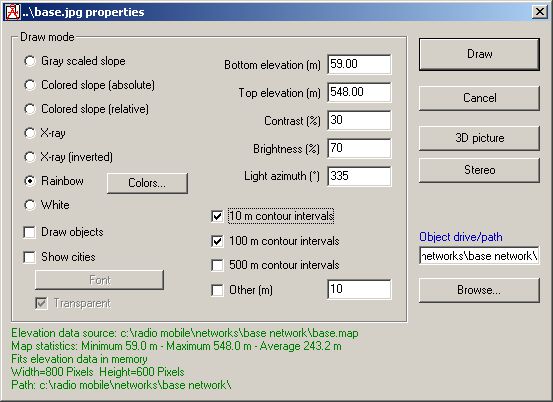
location - or not have it displayed - open the 'File/Picture properties' pane or
click on the toolbar icon
This pane is where the format of map displayed can be selected, including the automatic drawing of elevation contours. The bottom Green text gives all the data relative to the map, including the data source location. The location shown here is from my initial 'Base Network' as I have generated a Networks folder within which I keep all my separate individual network folders. The advantage of this is that all pictures and maps relevant to a particular network are in one folder - and similar names can be used for pictures without conflict. When Rainbow colours are selected as the Draw Mode, a left click on the Colours button produces another pane where the displayed colours and elevation ranges may be changed. At the lower right of this pane is the area controlling the legend position, with a check box to disable it.
Default file - Colors.dat
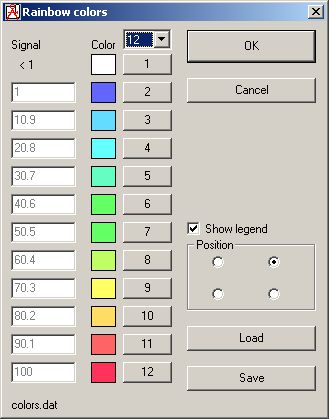
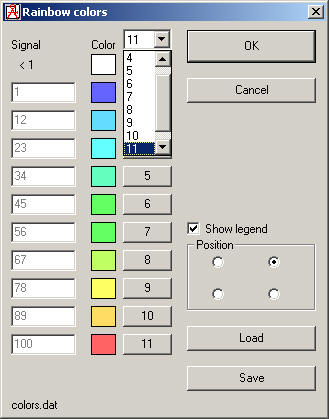
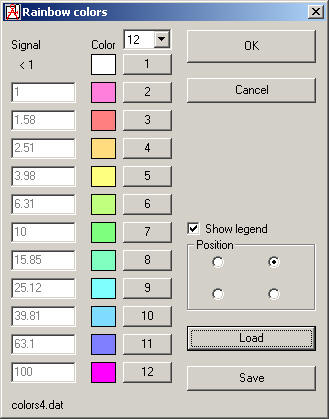
Selecting the colour Legend steps and omissions : A new feature on the Rainbow colours pane is demonstrated below. On the Colors.dat pane shown on the left, the highlighted '12' box can be seen which has a drop down list arrow beside it. The default setting for the number of steps used by the program for the Rainbow plots and also shown on the Legend is 12 steps. By accessing the drop down list this can be varied from 12 to 3 steps as required. The modified version on the right illustrates the result with 11 steps selected which produces integer bands of signal levels. By modifying the 'Signal range to plot' and also the number of steps within that range to be displayed allows the plots and Legend to be customised for your own requirements.
Colors.dat Colors.dat-modified
Omitting Signal ranges from plots: Where it is required to omit a signal range from the legend and plots, the colour selected for the range should be set to 'full White' - I use this term as all the colour panes provided by my installer have their white ranges set with a very pale Grey colour. This is to maintain compatibility with earlier versions of RM and produce the coverage plot formats expected
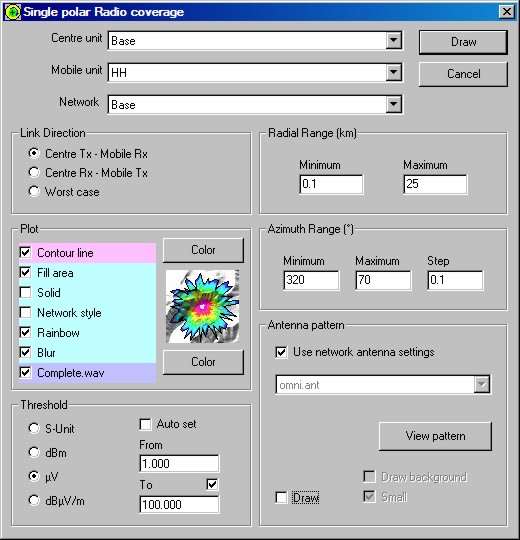
Plot Signal Strength Legend location:
The signal strength legend is visible and placed in the Top Left corner of a plot by default. If you wish to change its location - or not have it displayed - open the Single Polar Radio coverage pane.
This pane is where the details of the plot to be drawn can be seen.
When Rainbow colours are selected in the Plot area, a left click on the Colour button adjacent to the 'Fill area' produces another pane where the displayed colours may be changed and signal level ranges examined. At the lower right of this pane is the area controlling the legend position, with a check box to disable it.
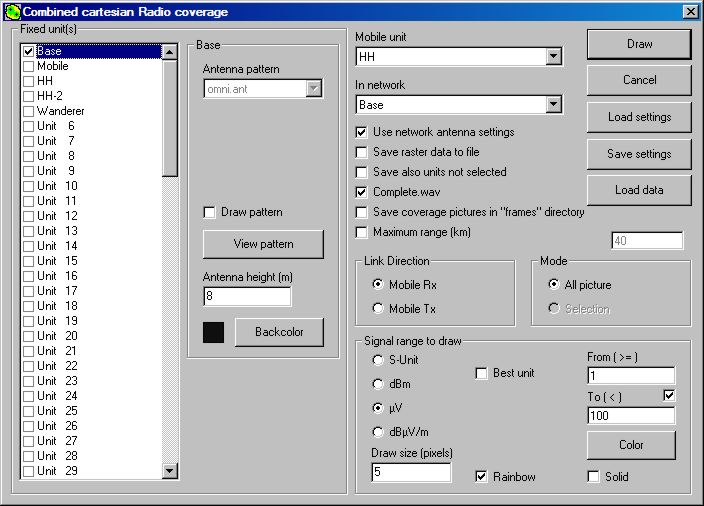
Similarly for Combined Cartesian coverage, where the pane below is displayed:
A click on the Colour button in the 'Signal range to draw' area, when Rainbow colours are selected, then produces the same Rainbow colours pane as above, with the legend location being selectable.
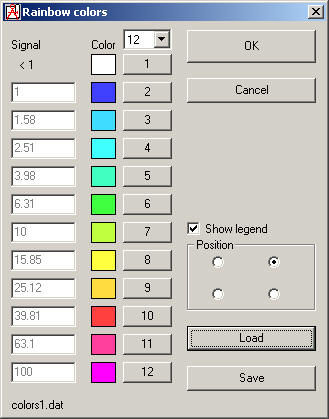
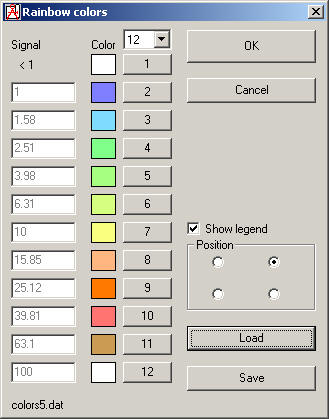
Changing the Colour pallet for plots: When the Rainbow Colours pane is open, a click on the 'Load' button will open a browse pane showing the RM folder and a different Colour pallet can be selected - named 'Colour*.dat' where '*' represents 1 to 5 for the extra five pallets available as shown below.
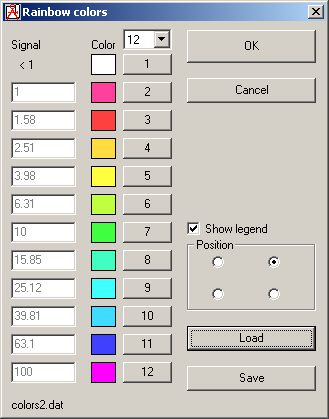
Colors1.dat Colors2.dat
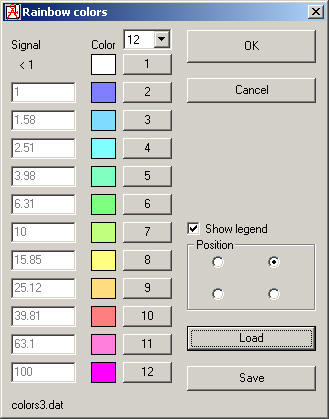
Colors3.dat Colors4.dat
Colors5.dat
A click on a number by a colour, opens a colour pane which allows the colour to be changed as required. The new colour selection can then be saved for future use by using the 'Save' button.
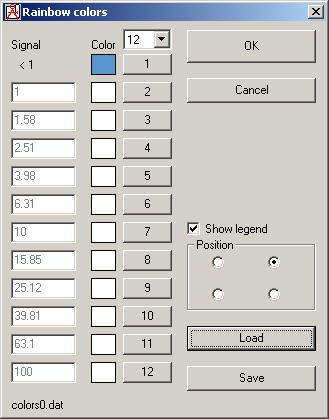
The following 'Color0.dat' has had all colours in the range saved as White, with levels below the range set as Blue. This is particularly useful where a single colour area is required showing that a criterion has been met on the plot. Use of this colour pallet is most useful for the 'Find Best Sites' plot where, for instance, a white area for more than 20% coverage may be plotted, with areas of <20% shown as blue.
Colors0.dat
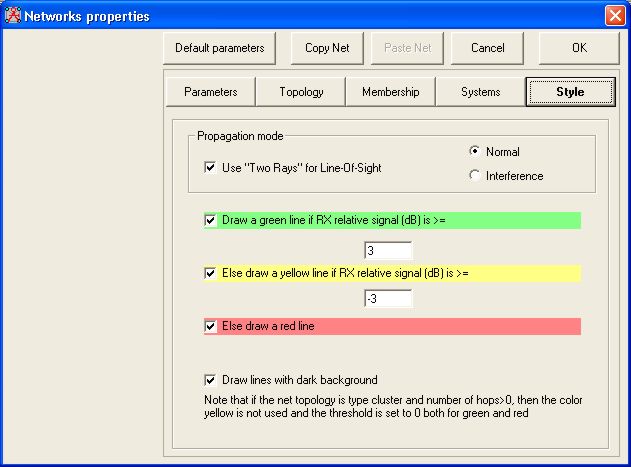
The Style pane, is available from the Network Properties pane (File/Network Properties),
or by clicking the Toolbar icon:
A click on the Style button shows the level definitions selected for the Network signal path displays, where a +/-3dB signal level relative to receiver sensitivity is selected as a Yellow line. Signals >3dB being shown in Green, and <-3dB shown as Red by default. The check boxes adjacent to the coloured lines define whether a Network display shows these colours on the plot - i.e. only Green signal level links could be selected showing signals links >+3dB above the receiver threshold if required. Changing the level (dB) settings, alters the threshold colour contour overlay line plots for the Radio Link and Route panes, and also the drawn Route - Note that the check box selection of colours don't apply to these plots, only on the Network plot! With a Network, Radio Link and Route plot, the Yellow overlay colour can be removed by selecting the same level in the two 'dB' boxes, to give a display with Green and Red plots only.
But see Network, Radio Link and Route Styles for screenshots of the effects!
The file 'Fix_Elev_Thr.dat', resident in the root of the RM folder, sets the antenna height above which it is considered to be 'Above Sea Level' rather than 'Above Ground Level'. The preset value is 2000m, but this can be changed using Notepad to your required value.
Keyboard arrows Move cursor
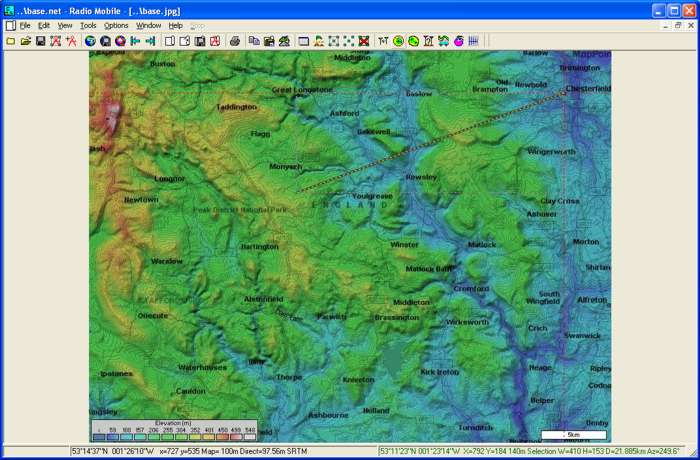
Measure Azimuth and Range from a Unit:
Where a Single Unit has been selected using 'SHIFT-click' on its icon, a SHIFT-'Left click' anywhere on the picture produces a volatile 'yellow/black' Azimuth line between the Unit and that location.
The Azimuth and range to the point from the Unit being reported on the main window Status area as an additional measurement tool. This can be seen here.
Shortcuts on the Radio Link Pane
Functions during Coverage Plots
Shortcuts on the Route Pane
Note: When small step increments are set using 'Edit/Options' from the Radio Coverage options pane - e.g. 10m - a scroll bar will appear at the bottom of the Radio Coverage pane, as only a portion of the route will appear in the window. A click on the scroll button causing it to blink, will allow the point on the route being viewed to be moved using the arrow keys. A 'Tab' will transfer control to the cursor, which then can be moved using the arrow keys. Shift+arrow key places the cursor in centre screen, with the route panning behind it. The 'Shift+click' actions still operate, and the total route radio performance can be examined by moving the scroll button. To return the expanded view to the Cursor position, 'Left click' in the top green area of the window (or use Shift+ an arrow key).
Shortcuts on the Antenna Viewer pane
When working with directional antennas, the different ways
of defining their network azimuths and the location of the control panes may not
be obvious. This page may help
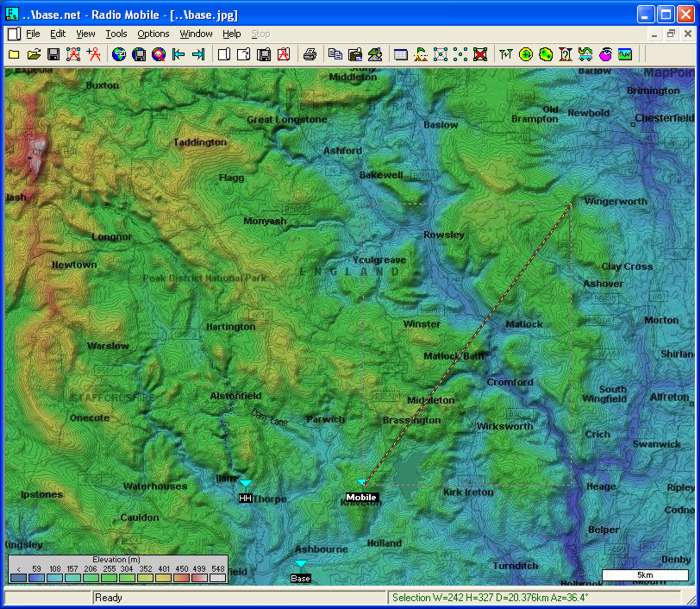
To measure the Distance and Azimuth between two points on the map, 'mouse button click' on the required origin location to produce the cursor cross wires, and then using 'Click and drag' draw out a Marquee box between the origin and destination locations as shown below. The Azimuth and distance between the points will be reported on the main screen status area, with a yellow/black line joining the points.
A 'Right click and drag' outside the marquee box will move the destination point, whilst a 'Right click' inside the box will show a pane asking if you wish to generate a zoom of the box area.
Where a Single Unit has been selected using 'SHIFT- click' on its icon, a 'SHIFT- click' anywhere on the picture produces a volatile 'yellow/black' Azimuth line between the Unit and that location.
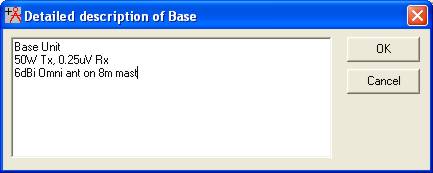
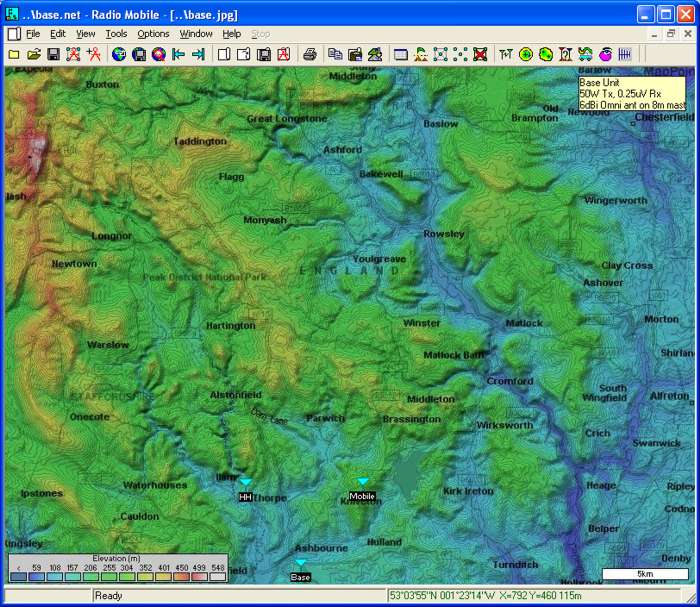
As an additional feature, a click on the + button by the Unit Name on the Unit Properties pane, opens the following pane where a description of the Unit can be saved.
The significance of this description pane is that, by performing a 'Left click' on the Unit, the description will be displayed on the main screen as shown below. A left click on the description message closes it.
Showing icons for multiple units at a single location
I have designed four sets of new icons which have been added to my Base Network Icon folder. These new icons can also be downloaded from my 'RM Downloads' page, and unzipped into an existing icon folder if required.
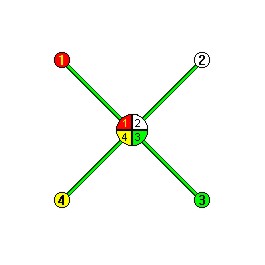
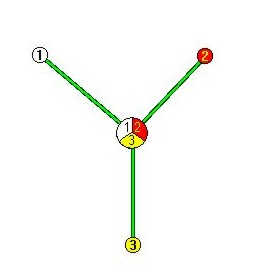
The first set of icons consist of quarter and half sectors in a + 90º format to be used with units which are co-located. The icon sets are in four colours, and as an example could be used to identify four separate links from a central location by using their respective colours in a network diagram.
The set also contains 180º half sectors which can be used together, or in combination with the 90º quarter sectors shown above.
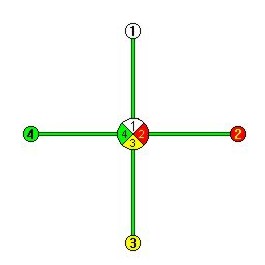
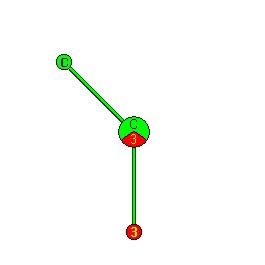
The second set of icons is similar, but in this case the sectors are arranged in X 90º format allowing units to match up with link directions as shown.
Again there are 180º half sectors which can be used with the 90º quarter sectors as required.
These icons can be used to display two, three or four Units at a single location with various link directions. No labels have been used above, but the actual location can be identified by just using a single label.
The third set of icons are in a
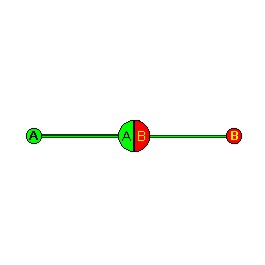
Where three units can be shown co-located, or with just two units in a form such as shown here, using a 240º sector to accommodate different directions of links.
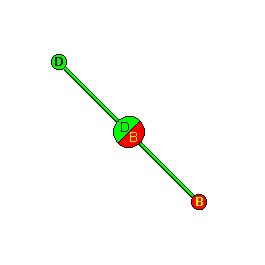
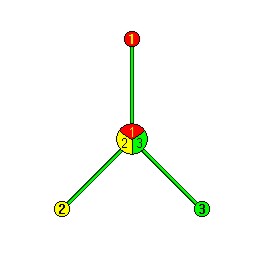
The final set of icons are in a Y 120º format to complete the variations.
Where once more there are 240º sectors available if required.
UK National Grid Reference Converters
Jeff, G8HUL, has written this converter for use with Radio Mobile. An installer 'NGR Setup.exe' in zip format, which places a shortcut on your desktop, and the NGR.exe file in the Radio Mobile folder, is available here.
Activating the program after RM has been launched, produces a small pane which shows the mouse pointer location in WGS-84 and also OSGB-36 Lat/Long and NGR formats.
He has also produced a similar version for the Irish Grid 'IrishNGR.exe'. The program file needs to be placed in the RM folder, and a shortcut put on your desktop. which is run in the same way as the above, and is available here in zip format.
Jeff's 'stand-alone' National Grid Reference converter 'Lat-Lon Converter.exe' is available here in zip format.
The installation file, and also the Program files, are available from my Downloads page.
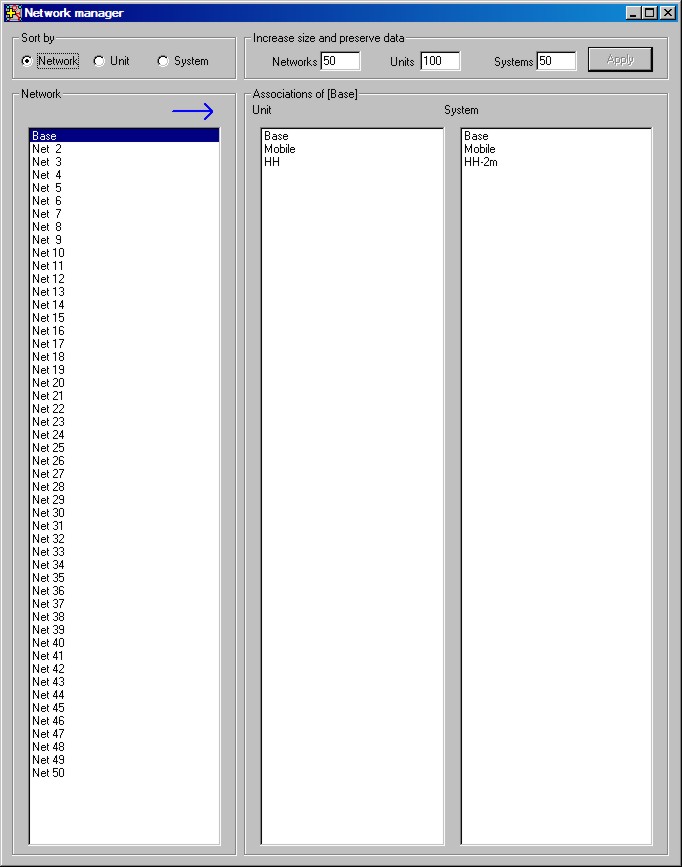
Increasing the number of Units, Systems and Networks available Where it is required to change the number of Units, Systems or Networks available for a particular Network, this can be achieved using the Network Manager pane. To access the pane, open 'Tools/Network Manger' or Ctrl-N to produce the pane below. On this pane the numbers can be increased as required without the loss of any existing data.
This page is available in .pdf format here
Please keep checking back for updates/additions.
Don't forget the Handbooks
© Copyright G3TVU 1st February 2016
| |||||||||||||||||||||||||||||||||||||||||||||||||||||||||||||||||||||||||||||||||||||||||||||||||||||||||||||||||||||||||||||||||||||||||||||||||||||||||||||||||||||||||||||||||||||||||||||||||||||||||||||||||||
 Para el
Handbook
Para el
Handbook