RM Batch Files
I can be contacted at E-mail address:-
![]()
RM Batch FilesI can be contacted at E-mail address:-
|
|
|
An additional feature added to Radio Mobile is the ability to generate command line Batch Files that enable a sequence of radial Combined Cartesian plots to be performed from a listing of requirements.
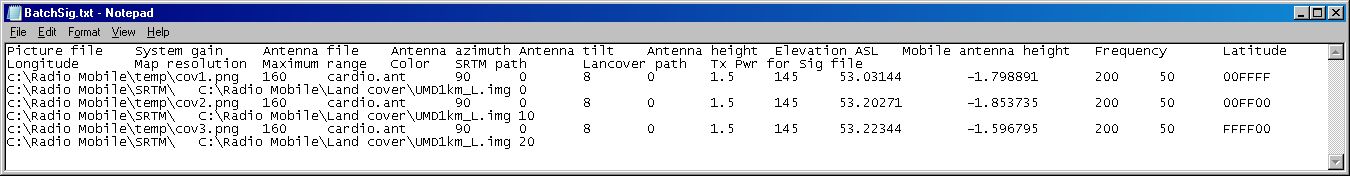
As an illustration of the required format I have generated the following text file designed to generate coverage plots for the three units in my ‘BaseU-3B’ network consisting of three base units and the mobile selected as a Hand Held unit.
This picture shows my text file displayed with word wrap enabled which doesn’t allow the correspondence of the data to headings to be seen.
By importing the text file into Excel the data is shown with all my folder paths including the local path to my Land cover data.
As an alternative where Geodata and Land cover data are saved on separate computer drives rather than in the Radio Mobile folder, the paths can be seen below.
The data can then be exported from Excel as a Tab separated text file after entry into the correct columns.
Data for the plots consists of tab separated entries in a text (.txt) file under the following 24 headings:
Notes: The System gain is calculated from: System Gain = Tx Power (dBm) – Tx Line Loss (dB) + Tx Ant Gain (dBi) + Rx Ant Gain (dBi) – Rx Line Loss (dB) – Rx Threshold (dBm)
Where Tx and Rx refer to Transmit and Receive data respectively.
Elevation ASL: Fixed unit elevation Above Sea Level – however if the elevation value entered is below map ground elevation this will be substituted from the interpolated SRTM data. Thus entering 0 metres will cause the map elevation to be used.
Map resolution and plot range: Selecting a Map resolution of 30m per pixel with a Range of 60km would produce a radial plot on a 4000x4000 pixels picture covering a 120km x 120km square area.
Colour: The Hexadecimal codes in Blue-Green-Red order (as the required format for entry into the Batch file) for 15 basic colours are:-
SRTM path: This has to be the path to your own SRTM data. When using my installer for 3-arcsecond data this resides in the folder located at C:\Radio Mobile\SRTM3, or if 1-arcsecond data is being used at C:\Radio Mobile\SRTM1. As an example when using another drive for Geodata this could be P:\Geodata\SRTM1.
Land coverage path: Once more this has to be the path to your own Landcover folder and also reflect the format of the data in use. The .img data used before was lower resolution and has been superseded. With my installer the folder location is at C:\Radio Mobile\Landcover\*.lcv, but on an alternate Geodata drive where .lcv data is to be stored in tiled format this could be shown as P:\Geodata\Landcover\*.lcv
Percentage Variability: The percentage of situations range of variability – nominally 70% but can be used as a fine adjustment for coverage plot calibration.
Rainbow colour file: Enter the path to your own required colours*.dat file. With my installer this will lie in the root of the Radio Mobile folder at C:\Radio Mobile\colours*.dat
Rainbow range dB: Enter the decibel range to be displayed in the plots.
Azimuth from: Enter the start azimuth to be displayed in the plots. If you enter a value here the plot is performed in polar mode, but the plot increment is calculated to produce a 1 pixel resolution as with Combined Cartesian but at a much higher speed. Azimuth to: Enter the finish azimuth to be displayed in the plots. If you enter a value here the plot is performed in polar mode, but the plot increment is calculated to produce a 1 pixel resolution as with Combined Cartesian but at a much higher speed. LOS mode: Line Of Sight path settings: '0' generates a plot using the normal Two Ray method, '1' generates a plot where the Two Ray calculation is optimistic for interference, '2' generates a plot which uses no Two Ray calculations in LOS.
This page is available in .pdf format here
Please keep checking back for updates/additions.
© Copyright G3TVU 1st February 2016
|